

Relationship between fractional anisotropy of cerebral white matter and metabolite concentrations measured using (1)H magnetic resonance spectroscopy in healthy adults
- PMID: 23073233
- PMCID: PMC3779655
- DOI: 10.1016/j.neuroimage.2012.10.014
Relationship between fractional anisotropy of cerebral white matter and metabolite concentrations measured using (1)H magnetic resonance spectroscopy in healthy adults
Abstract
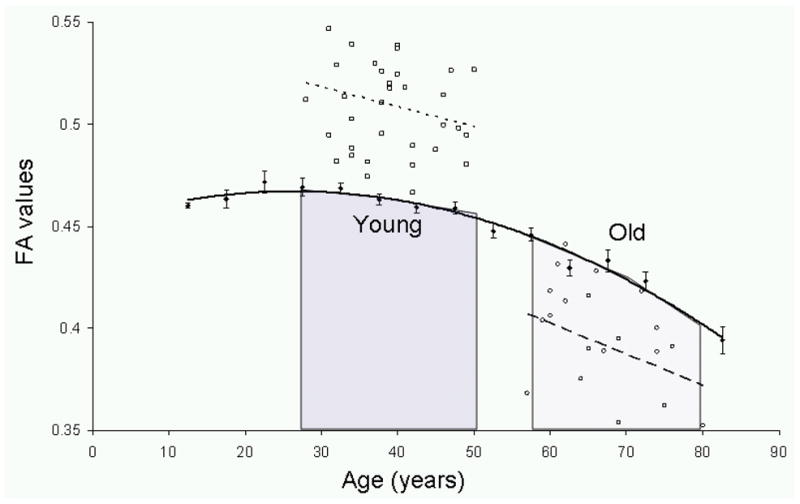
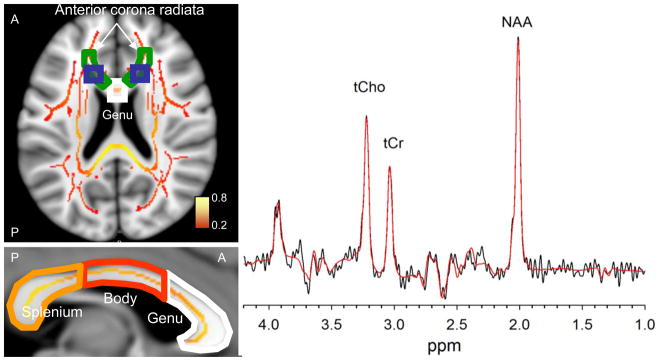
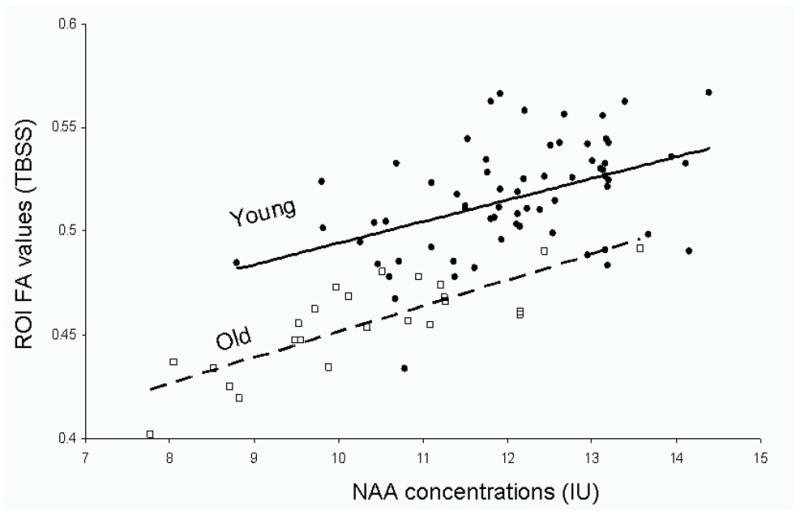
Fractional anisotropy (FA) of water diffusion in cerebral white matter (WM), derived from diffusion tensor imaging (DTI), is a sensitive index of microscopic WM integrity. Physiological and metabolic factors that explain intersubject variability in FA values were evaluated in two cohorts of healthy adults of different age spans (N=65, range: 28-50years; and N=25, age=66.6±6.2, range: 57-80years). Single voxel magnetic resonance spectroscopy (MRS) was used to measure N-acetylaspartate (NAA), total choline-containing compounds, and total creatine, bilaterally in an associative WM tract: anterior corona radiata (ACR). FA values were calculated for the underlying, proximal and two distal WM regions. Two-stage regression analysis was used to calculate the proportion of variability in FA values explained by spectroscopy measurements, at the first stage, and subject's age, at the second stage. WM NAA concentration explained 23% and 66% of intersubject variability (p<0.001) in the FA of the underlying WM in the younger and older cohorts, respectively. WM NAA concentration also explained a significant proportion of variability in FA of the genu of corpus callosum (CC), a proximal WM tract where some of the fibers contained within the spectroscopic voxel decussate. NAA concentrations also explained a significant proportion of variability in the FA values in the splenium of CC, a distal WM tract that also carries associative fibers, in both cohorts. These results suggest that MRS measurements explained a significant proportion of variability in FA values in both proximal and distal WM tracts that carry similar fiber-types.
Keywords: Diffusion tensor imaging; Magnetic resonance spectroscopy; N-acetylaspartate; White matter.
Copyright © 2012 Elsevier Inc. All rights reserved.
Conflict of interest statement
Authors have no conflict of interest information to disclose.
Figures
Similar articles
-
Evaluation of early cerebral metabolic, perfusion and microstructural changes in HCV-positive patients: a pilot study.J Hepatol. 2013 Oct;59(4):651-7. doi: 10.1016/j.jhep.2013.05.008. Epub 2013 May 13. J Hepatol. 2013. PMID: 23680314
-
Correlation of fractional anisotropy and metabolite concentrations measured using 1H-MRS of cerebral white matter in healthy adults.Biomed Mater Eng. 2014;24(6):3017-24. doi: 10.3233/BME-141122. Biomed Mater Eng. 2014. PMID: 25227009
-
Combining diffusion tensor imaging and magnetic resonance spectroscopy to study reduced frontal white matter integrity in youths with family histories of substance use disorders.Hum Brain Mapp. 2014 Dec;35(12):5877-87. doi: 10.1002/hbm.22591. Epub 2014 Jul 21. Hum Brain Mapp. 2014. PMID: 25044331 Free PMC article.
-
The role of diffusion tensor imaging and fractional anisotropy in the evaluation of patients with idiopathic normal pressure hydrocephalus: a literature review.Neurosurg Focus. 2016 Sep;41(3):E12. doi: 10.3171/2016.6.FOCUS16192. Neurosurg Focus. 2016. PMID: 27581308 Review.
-
White matter integrity differences in obesity: A meta-analysis of diffusion tensor imaging studies.Neurosci Biobehav Rev. 2021 Oct;129:133-141. doi: 10.1016/j.neubiorev.2021.07.020. Epub 2021 Jul 17. Neurosci Biobehav Rev. 2021. PMID: 34284063 Review.
Cited by
-
N-acetyl-aspartate levels correlate with intra-axonal compartment parameters from diffusion MRI.Neuroimage. 2015 Sep;118:334-43. doi: 10.1016/j.neuroimage.2015.05.061. Epub 2015 May 30. Neuroimage. 2015. PMID: 26037050 Free PMC article.
-
Relation between brain temperature and white matter damage in subacute carbon monoxide poisoning.Sci Rep. 2016 Nov 7;6:36523. doi: 10.1038/srep36523. Sci Rep. 2016. PMID: 27819312 Free PMC article.
-
Assessment of whole brain white matter integrity in youths and young adults with a family history of substance-use disorders.Hum Brain Mapp. 2014 Nov;35(11):5401-13. doi: 10.1002/hbm.22559. Epub 2014 May 27. Hum Brain Mapp. 2014. PMID: 24867528 Free PMC article.
-
Reproducibility of tract-based white matter microstructural measures using the ENIGMA-DTI protocol.Brain Behav. 2017 Jan 14;7(2):e00615. doi: 10.1002/brb3.615. eCollection 2017 Feb. Brain Behav. 2017. PMID: 28239525 Free PMC article.
-
Striatal activity and reduced white matter increase frontal activity in youths with family histories of alcohol and other substance-use disorders performing a go/no-go task.Brain Behav. 2015 Jul;5(7):e00352. doi: 10.1002/brb3.352. Epub 2015 May 28. Brain Behav. 2015. PMID: 26221573 Free PMC article.
References
-
- Aboitiz F. Brain connections: interhemispheric fiber systems and anatomical brain asymmetries in humans. Biol Res. 1992;25:51–61. - PubMed
-
- Aboitiz F, Scheibel AB, Fisher RS, Zaidel E. Fiber composition of the human corpus callosum. Brain Res. 1992;598:143–153. - PubMed
-
- Ashburner J, Friston KJ. Voxel-based morphometry--the methods. Neuroimage. 2000;11:805–821. - PubMed
-
- Balestrino M, Lensman M, Parodi M, Perasso L, Rebaudo R, Melani R, Polenov S, Cupello A. Role of creatine and phosphocreatine in neuronal protection from anoxic and ischemic damage. Amino Acids. 2002;23:221–229. - PubMed
-
- Bartzokis G, Beckson M, Lu PH, Nuechterlein KH, Edwards N, Mintz J. Age-related changes in frontal and temporal lobe volumes in men: a magnetic resonance imaging study. Arch Gen Psychiatry. 2001;58:461–465. - PubMed
Publication types
MeSH terms
Substances
Grants and funding
LinkOut - more resources
Full Text Sources
Other Literature Sources
