Review
. 2012 Dec 12;112(12):6388-430.
doi: 10.1021/cr300141q. Epub 2012 Oct 11.

Obstructing toxin pathways by targeted pore blockage

Affiliations
Review

Obstructing toxin pathways by targeted pore blockage

Ekaterina M Nestorovich et al. Chem Rev. .
No abstract available


Figures

Figure 1
Figure 1
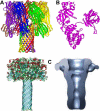
Typical membrane-perforating, AB-type, and binary bacterial toxins α-hemolysin of Staphylococcus aureus, diphtheria toxins of Corynebacterium diphtheriae, and the channel-forming PA63 component of anthrax toxin of Bacillus anthracis. A: Ribbon representation of 1.9 Å crystal structure of heptameric α-hemolysin . PDB ID: 7AHL. B: 2.3 Å nucleotide-free crystal structure of monomeric single-chain diphtheria toxin. PDB ID: 1SGK. C, left: Molecular model of the heptameric PA63 pore. Reprinted with permission from ref. Taylor & Francis Copyright 2004. C, right: Three-dimensional reconstruction of the PA63 pore based on the electron microscopy structure. Reprinted with permission from ref. Copyright 2008. Nature Publishing Group.
Figure 2
Figure 2
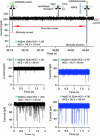
Schematic illustration of planar lipid bilayer membrane formation (1, 2) and high-resolution single-channel recordings (3, 4).
Figure 3
Figure 3
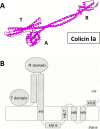
Pore-forming colicin Ia. A: Colicin Ia crystal structure at the 3 Å resolution. PDB ID: 1CII. B: Schematic diagram of the open state of the whole colicin Ia molecule inserted into a planar bilayer. Reprinted with permission from ref. Copyright 2000. The Rockefeller University Press.
Figure 4
Figure 4
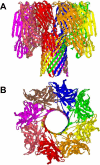
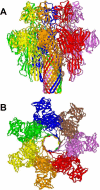
Ribbon representation of the 2.5Å crystal structure of bi-component octameric γ-hemolysin. PDB ID: 3B07. Side (A) and top (B) views are shown.
Figure 5
Figure 5
A: The effect of symmetrical addition of polyethylene glycol (PEG) of different molecular weights in 15% w/w concentration on the ion current through a single ETX channel. It is seen that PEGs not only change the average conductance but, depending on molecular weight, induce significant fluctuations. B and C: Experiments performed under asymmetrical PEG additions demonstrate that these fluctuations are mostly caused by permeant PEGs added to the trans side of the membrane. Time resolution was 0.1 ms, transmembrane voltage −100 mV. Reprinted with permission from ref. Copyright 2010. Biophysical Society.
Figure 6
Figure 6
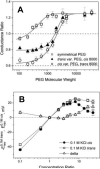
A: The relative change in ETX channel conductance as a function of PEG molecular weight. The trans and cis side applications of polymers of varying molecular weights, solid triangles and open squares, respectively, have different effects on the channel conductance. The impermeant PEG 8000 was on the opposite side of the membrane. The effect of symmetrical addition of PEG is shown by open circles. Dotted line at 0.6 corresponds to the ratio of bulk solution conductivities with and without polymers. B: Channel reversal potential as a function of the concentration ratio for two series of measurements with the oppositely directed gradients. Erev was obtained in the series of experiments where ccis was kept constant at 0.1 M KCl and ctrans was varied from 0.01 M KCl to 3 M KCl (solid circles). –Erev was measured in the reversed gradient where ctrans = 0.1 M KCl and ccis was changed from 0.01 M KCl to 3 M KCl (open squares). The channel is asymmetric: the absolute value of the reversal potential is smaller when the more concentrated solution is on the trans side of the membrane. Open triangles show the difference. Reprinted with permission from ref. Copyright 2010. Biophysical Society.
Figure 7
Figure 7
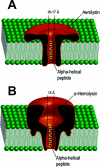
Schematic representation of the single oligomeric aerolysin (left) and α-hemolysin (right) pores incorporated into planar lipid bilayers with linear α-helical peptides traversing the channels. Adapted with permission from ref. Copyright 2006. American Chemical Society.
Figure 8
Figure 8
Single-channel current recordings showing unfolded protein transport across the aerolysin pore as a function of applied voltage: V = 80 mV (middle), V = 110 mV (top), and V = 130 mV (bottom), for the wild-type protein MalEwt (black), and mutant protein, MalE219 (blue). The stem domain of the aerolysin pore was on the cis side of the lipid bilayer, and the proteins entered by the stem side. Analysis of the current tracks (top) shows the difference between bumping or translocation events. An increase in the applied voltage results in the increase of the frequency of single channel ionic current blockades (middle and bottom). Reprinted with permission from ref. Copyright 2011. American Chemical Society.
Figure 9
Figure 9
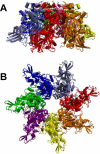
Ribbon representation of the 2.88 Å crystal structure of heptameric Vibrio cholerae cytolysin. Side (A) and top (B) views are shown. PDB ID: 3044.
Figure 10
Figure 10
Perforin pore structure. A: Negative stain and cryo-electron microscopy images of perforin-containing liposomes. Surface (B) and cut-away (C) views of a cryo-electron microscopy reconstruction of the perforin pore with 20-fold symmetry. The map resolution was 28.5 Å. Reprinted and modified with permission from ref. Copyright 2002. Nature Publishing Group.
Figure 11
Figure 11
Two models of membrane insertion for the cholesterol-dependent cytolysins. A: the prepore model for the assembly and insertion of CDC. B: continuous growth model. The number of monomers comprising the multimer is designated as (n). Reprinted with permission from ref. Copyright 2000. American Chemical Society.
Figure 12
Figure 12
Schematic representation of the diphtheria toxin transmembrane domain incorporated into the endosomal vesicle membrane, which results in the formation of a transmembrane pore. Reprinted with permission from ref. Copyright 2011. MDPI AG.
Figure 13
Figure 13
Gating characteristics of the different T-domain constructs studied on a single-channel level . A: A single channel formed by wild-type T-domain (lacking H6 tag) remains open at both +60 and −60 mV, with irresolvably brief flickerings to a zero-conductance closed state. B: A single channel formed by T-domain with an N-terminal H6 tag remains open at +65 mV but rapidly closes to zero conductance at −65 mV. C: A single channel formed by T-domain with a C-terminal H6 tag spends a good deal of time in the zero-conductance closed state at +65 mV and remains open at −65 mV like the wild-type channel. D: A single channel formed by T-domain with both N- and C-terminal H6 tags is blocked at both +65 and −65 mV. At positive voltages, the channel fluctuates rapidly between the open and closed states, spending about half of its time in each. At negative voltage pulses, the channel remains open briefly, before fully closing for the duration of the pulse. Reprinted with permission from ref. Copyright 2001. The Rockefeller University Press.
Figure 14
Figure 14
Sequence of events showing BoNT light chain translocation through the heavy chain channel. Step1. BoNT/A holotoxin prior to insertion in the membrane (grey bar with magenta boundaries); BoNT/A is represented by the crystal structure rendered on YASARA using PDB accession code 3BTA. Step 2. Schematic representation of the membrane inserted BoNT/A during an entry event. Steps 3 and 4. A series of transfer steps. Step 5. An exit event. Segments of typical single channel recordings are displayed under the corresponding interpretation for each step. Reprinted with permission from ref. Copyright 2009. Elsevier.
Figure 15
Figure 15
Basic mechanisms of cell intoxication by Clostridium and Bacillus binary toxins. Cell-binding B-precursors are first activated by proteolytic cleavage in solution or on the cell surface (B. anthracis PA83 only). Subsequently, activated B components interact with specific cell surface receptors as either preformed ring-shaped heptamers or monomers that form heptamers on the cell surface. The enzymatic A components bind to the cell-associated B heptamer, and the receptor-toxin complex then undertakes receptor-mediated endocytosis. An acidic endosomal environment is essential for translocating the A components into the cytosol. Reprinted with permission from ref. Copyright 2004. ASM Press.
Figure 16
Figure 16
Ribbon representation of 3.6 Å crystal structure of heptameric prepore of channel-forming component of anthrax toxin, PA63. Side (A) and top (B) views are presented. PDB ID: 1TZN.
Figure 17
Figure 17
A: Schematic representation for anthrax toxin receptor-mediated cell assembly and entry into a target cell. First, proteolytically activated PA monomers (PA63) oligomerize into the ring-shaped heptameric, (PA63)7, or octameric, (PA63)8, complexes, which are able to dock 3 or 4 enzymatic A components, LF and/or EF, respectively. These oligomeric prepores are then endocytosed and, under the acidic endosomal pH, converted to the transmembrane channels, which transport LF and EF into the cytosol. B: A possible protein unfolding and translocation pathway for anthrax toxin depicted in three successive steps: docking, protein unfolding, and translocation of the unfolded chain. Adapted with permission from ref. Copyright 2011. Wiley.
Figure 18
Figure 18
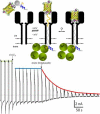
Representative example of a truncated H6-LFN construct (LFN 1–83), whose N terminus reached the trans solution. The N-terminal H6 tag is depicted in blue. The recording starts at the moment when an appropriate level of PA63-induced current is reached and the cis compartment is perfused to remove the unbound (PA63)7 from the solution. The voltage protocol of + 80 mV for 5 s and −40 mV for 15 s was then applied. At the first arrow, the LFN (1–83), with the YFP stopper (depicted as a β barrel) attached to the C-terminus and biotin (orange) attached at residue 1, is added to the cis solution, and a constant level of unblocking is obtained. At the second arrow, streptavidin (four green balls) is added to the trans compartment. A dramatic decrease of unblocking over time is recorded, thus demonstrating that the biotin at residue 1 has reached the trans solution and has been grabbed by streptavidin, thereby preventing those channels from becoming unblocked at −40 mV. Reprinted with permission from ref. Copyright 2011. The Rockefeller University Press.
Figure 19
Figure 19
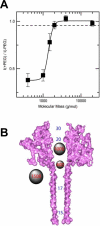
A: The molecular mass cutoff of the single heptameric PA63 channel as estimated from the effect of differently sized PEG molecules in planar bilayers. It is seen that the PEGs with MM <2000 Da are able to enter into the channel, which results in conductance decrease. The PEG concentration was 1.2% (w/w), and the applied potential was V = +70 mV. B: A cross-sectional view of the heptameric PA63 channel model and spherical representations of PEG 400, 1000, and 1500 molecules. Reprinted with permission from ref. Copyright 2008. Biophysical Society.
Figure 20
Figure 20
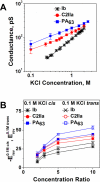
A: Conductances of the PA63, C2IIa, and Ib channels as functions of salt concentrations demonstrate different behaviors at small salts. The dependences are close to linear for Ib but show significant deviations from linearity for the PA63 and C2IIa channels. B: Single channel reversal potentials as functions of the ratio of salt concentrations on the different sides of the membrane for two series of measurements with oppositely directed gradients. Open circles: Reversal potential (Erev) obtained in the series of experiments where KCl concentration in the cis compartment exceeds that in the trans compartment; at that ctrans = 0.1 M KCl. Solid circles: The values of the reversal potential (-Erev) obtained for the reversed gradient ctrans > ccis = 0.1 M KCl. The sign of the reversal potential is inverted in the latter case to facilitate comparison; the selectivity stays cationic in both cases. The channels are asymmetric because the absolute value of the reversal potential is greater when the more concentrated solution is on the cis side of the membrane. Membranes were formed from the DPhPC at pH 6.
Figure 21
Figure 21
A: In the absence of blockers, ion currents through the PA63, C2IIa, and Ib single channels reconstituted into planar lipid membranes demonstrate fast flickering between the open and closed states. The currents are given at 1 ms time resolution. B: Power spectral densities of the currents shown in panel A display 1/f behavior. Measurements were taken in 1 M KCl solutions at pH 6 buffered by 5 mM MES. The applied voltage was 50 mV.
Figure 22
Figure 22
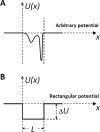
Schematic view of the particle's potential of mean force in a membrane channel. A: An arbitrary potential demonstrating different level of interaction with different parts of the channel along its axis (x coordinate). B: A hypothetical square-well potential.
Figure 23
Figure 23
Non-monotonic behavior of the flux given by Eq. (6) as a function of potential well depth at three different concentrations of translocating molecules and = 0. Reprinted with c2 permission from ref. Copyright 2005. Biophysical Society.
Figure 24
Figure 24
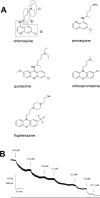
A: Structures of chloroquine and related compounds, which are able to block channel-forming B components of the binary toxins in the planar bilayers. B: Titration of membrane conductance induced by C2II with fluphenazine in 1 M KCl at the applied voltage of 20 mV. Reprinted with permission from ref. Copyright 2003. Elsevier.
Figure 25
Figure 25
A, top: Blocking anthrax on a single-channel level. A heptameric mushroom-like channel of PA63 produced by Bacillus anthracis believed to be a translocation pathway for lethal and edema factor, LF and EF, inside the cell under attack. The idea is to design complementary heptameric low-molecular weight compounds – cationic cyclodextrins (A, bottom) that enter the pore and block it as molecular plugs. Note that the cartoon is a simplified illustration of the LF and EF penetration into the mammalian cell. In reality, the process is much more complex (Figs. 15 and 17). Adapted with permission from ref. Copyright 2010. Ciophysical Society. B: Two 7-fold symmetrical synthetic molecules, per-6-S-(3-aminomethyl)thio-β-cyclodextrin (AMBnTβCD), left panel, and per-6-S-(3-amino)propylthio-β-cyclodextrin (AmPrβCD), right panel, were used as blockers of the PA63, C2IIa, and Ib pores. C: Planar lipid bilayer membrane containing about 60 PA63 channels in 0.1 M KCl. The downward arrow indicates the addition of AmPrβCD to the cis side of the membrane (side of PA addition). The dashed line shows zero current level. Adopted with permission from ref. Copyright 2005. National Academy of Sciences.
Figure 26
Figure 26
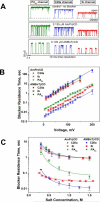
A: Ion currents through single PA63, C2IIa, and Ib channels in the absence (upper row of tracks) and in the presence of 0.135 μM AmPrβCD (middle row) and AMBnTβCD (bottom row) blockers in the cis side of the chamber. Measurements were taken in 1 M KCl solutions at pH 6 and 50 mV applied voltage. Recordings are shown at 10 ms time resolution. AMBnTβCD displays a significantly longer binding lifetime with all channels compared with AmPrβCD, whereas the time between the blockage events, characterizing the on-rate of the binding reaction, seems to be practically unchanged. B: Residence times of blocker binding to the channels plotted as functions of the transmembrane voltage reveal exponential voltage dependence. C: Residence times of blocker binding to the channels as functions of bulk salt concentration show different degrees of salt dependence for the three channels and two blockers. The salt dependence is most pronounced for AmPrβCD interacting with the PA63 pore. For the more efficient AMBnTβCD, the dependence is weaker.
Figure 27
Figure 27
Neutralization of the PA63 heptameric complexes by peptide-functionalized liposomes of about 50 nm in size. Left: The structure of the enzyme-binding face of heptameric PA63. Residues 197, 200, 207, 210 and 214, which form part of the LF-binding site, are highlighted in red. Approximate distances between residues 200 (30 Å) on adjacent monomers and residues 210 (40 Å) on adjacent monomers are indicated. Right: A schematic representation of a liposome-based anthrax toxin inhibitor. Reprinted with permission from ref. Copyright 2006. Nature Publishing Group.
Figure 28
Figure 28
Design of polyvalent inhibitors with control over the molecular weight and ligand spacing. The linear polyvalent inhibitors displaying peptides (black ovals) are shown bound to the PA63 heptamer at the peptide-binding sites (circles). The spacing between peptides on the linear scaffold is either too short (left panel) or is sufficient (right panel) to allow a polyvalent interaction. Reprinted with permission from ref. Copyright 2006. American Chemical Society.
Figure 29
Figure 29
Structure-based design of the heptavalent anthrax toxin inhibitors. A: The structure of the LF-binding face of heptameric PA63. Residues 184, 187, 197, and 200, which form part of the peptide-binding site are shown in purple. B: The structure of 7-fold symmetrical β-cyclodextrin, which was used as a scaffold for the heptameric inhibitor. C: A scheme illustrating the binding of a heptavalent inhibitor, synthesized by the attachment of seven inhibitory peptides to the β-cyclodextrin via an appropriate PEG linker, to heptameric PA63. Reprinted with permission from ref. Copyright 2011. American Chemical Society.
Figure 30
Figure 30
Modulation of the ion current through a single α-HL channel by 7-fold symmetrical βCD IB201 (Table 2, compound 31). In the absence of βCD, the current through the single α-HL channel is rather stable (no significant current fluctuations at 10 ms time resolution are seen). IB201 addition leads the channel to switch to a weakly conductive blocked sub-state. Reprinted with permission from ref. Copyright 2007. Elsevier.
Figure 31
Figure 31
Bilayer recordings showing the interaction of a single α-HL pore with βCD and the model analytes 2-adamantanamine (A1) and 1-adamantanecarboxylic acid (A2) at −40 mV applied voltage. α-HL was added to the cis compartment of the chamber and βCD and the adamantine derivatives were in the trans compartment. A: Control, single α-HL pore is unblocked (level 1). B: 20 mM trans-addition of βCD generates transient partial blockages of the channel (level 2). C: 80 mM trans-addition of 2-adamantanamine does not affect the fully open channel (level 1), but produces an additional block of α-HL- βCD complex (level 3). D: 20 mM trans-addition of 1-adamantanecarboxylic acid produces additional blockades (level 4), of the longer duration than those produced by 2-adamantanamine (level 3). Reprinted with permission from ref. Copyright 1999. Nature Publishing Group.
Figure 32
Figure 32
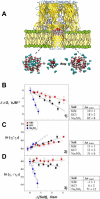
The single-molecule nanopore approach illustrated in Fig. 31 was used to study the dynamic side of the Hofmeister effect. A: Cartoon of the complexation process between the cyclodextrin hosted by the α-HL pore and adamantane carboxylate. B: Changes in the free energy of cyclodextrin– adamantane complexation, δΔG, versus changes in salt osmolarity. C: Effect of increasing osmolarity on the average residence time of adamantane in the channel-bound cyclodextrin, τr. D: Effect on the average time between the successive complexation events, τo. Both times are normalized by their values measured prior to extra salt addition. Tables on the right show the effective numbers of excluding water molecules. It is seen that not only the complex stability, as measured by the average adamantane residence time, but also the on-rates, represented by inverse τo, are influenced by salt addition and thus contribute to the changes in the complexation free energy. Reprinted with permission from ref. Copyright 2009. Wiley.

Similar articles

Cited by

References

    1. Parker MW, Feil SC. Prog. Biophys. Mol. Biol. 2005;88:91. - PubMed
    1. Henkel JS, Baldwin MR, Barbieri JT. EXS. 2010;100:1. - PMC - PubMed
    1. Barth H, Aktories K, Popoff MR, Stiles BG. Microbiol. Mol. Biol. Rev. 2004;68:373. - PMC - PubMed
    1. Menetrey J, Gillet D, Menez A. Toxicon. 2005;45:129. - PubMed
    1. Trujillo C, Ratts R, Tamayo A, Harrison R, Murphy JR. Neurotox Res. 2006;9:63. - PubMed

Publication types

MeSH terms