. 2012 Dec;86(24):13689-96.
doi: 10.1128/JVI.01595-12. Epub 2012 Oct 10.

Myeloid-derived suppressor cells regulate natural killer cell response to adenovirus-mediated gene transfer

Affiliations

Myeloid-derived suppressor cells regulate natural killer cell response to adenovirus-mediated gene transfer

Jiangao Zhu et al. J Virol. 2012 Dec.

Abstract

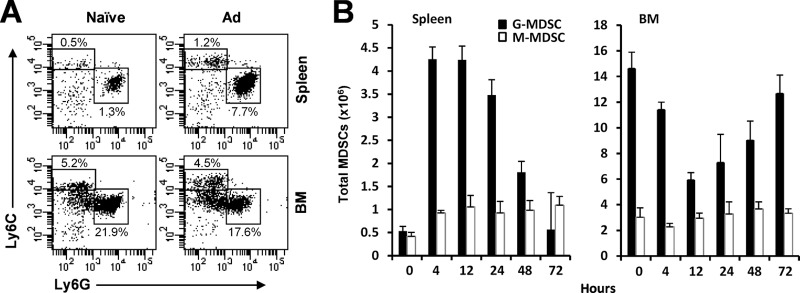
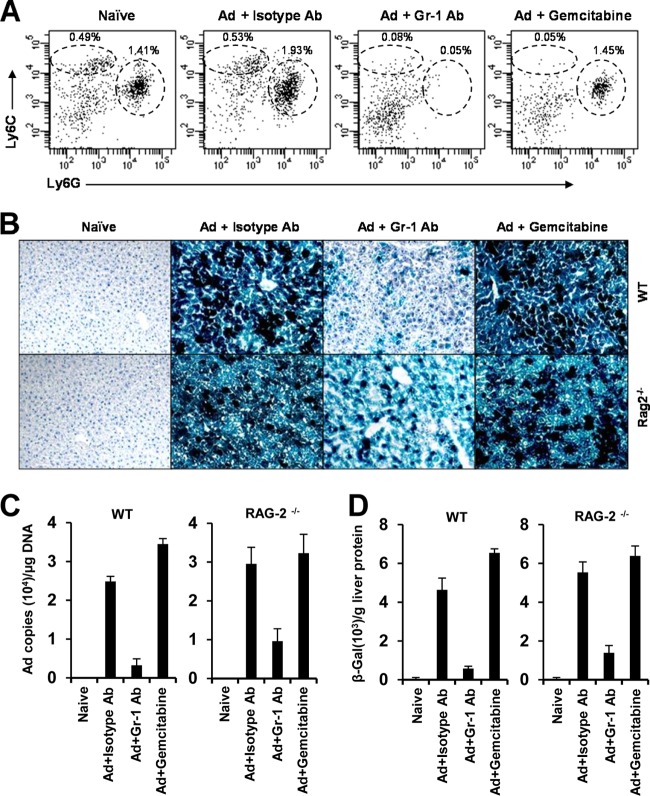
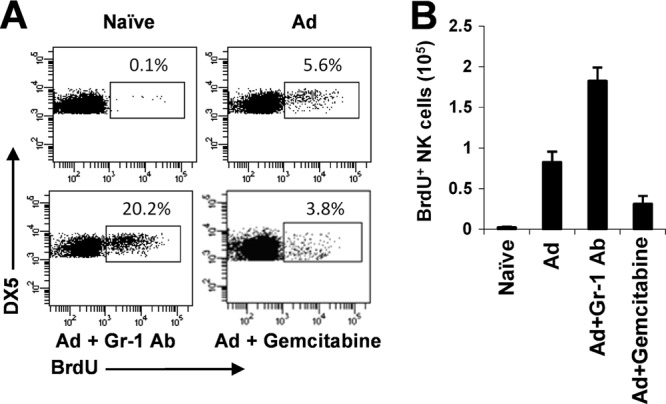
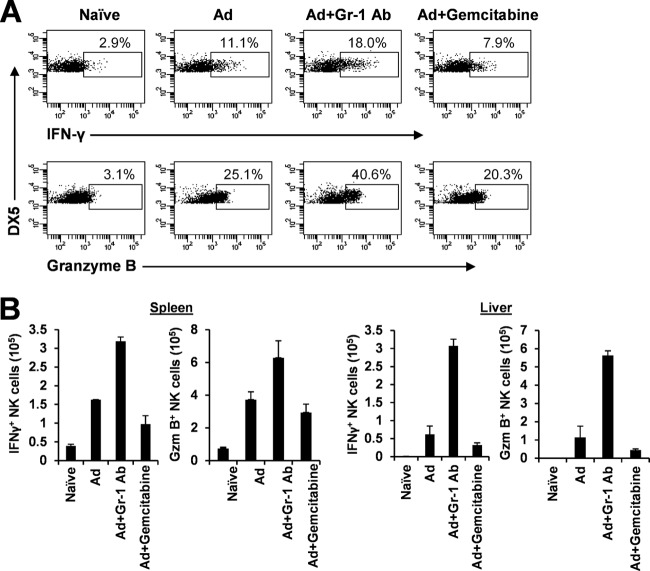
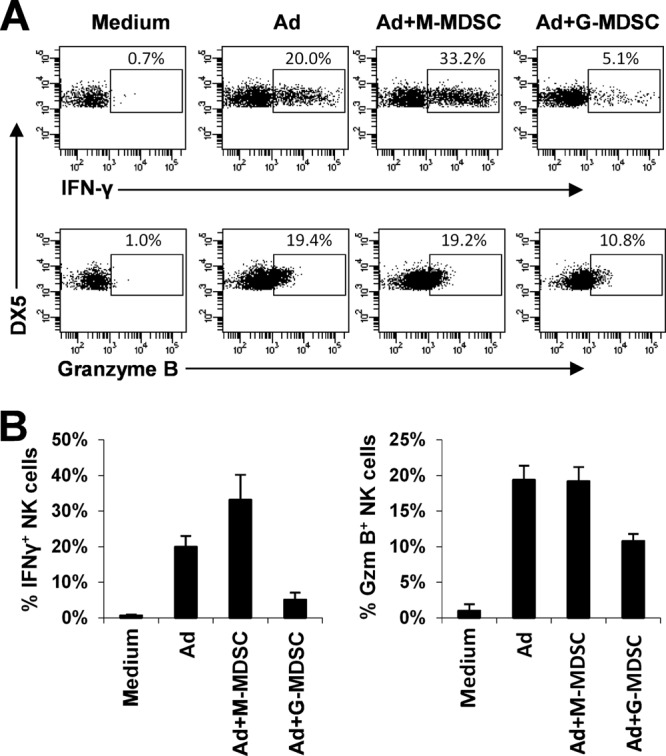
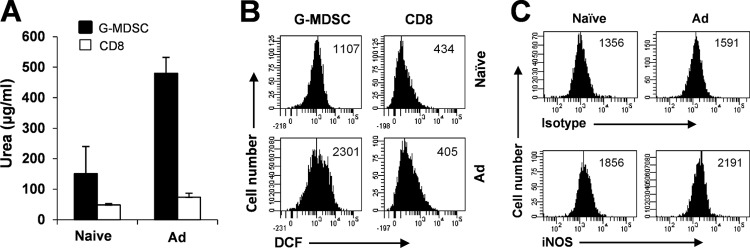
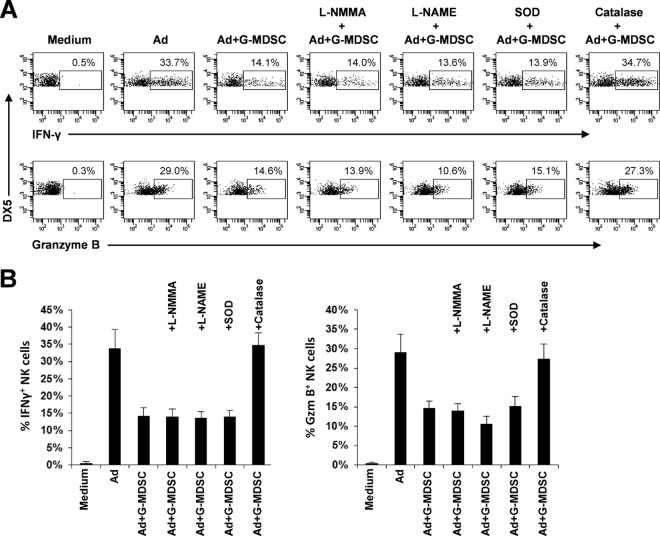
The attendant innate and adaptive immune responses to viral vectors have posed a significant hurdle for clinical application of viral vector-mediated gene therapy. Previous studies have shown that natural killer (NK) cells play a critical role in innate immune elimination of adenoviral vectors in the liver. However, it is not clear how the NK cell response to adenoviral vectors is regulated. In this study, we identified a role for granulocytic myeloid-derived suppressor cells (G-MDSCs) in this process. We show that in vivo administration of adenoviral vectors results in rapid accumulation of G-MDSCs early during adenoviral infection. In vivo depletion of both MDSC populations, but not monocytic MDSCs (M-MDSCs) alone, resulted in accelerated clearance of adenoviral vectors in the liver. This was accompanied by enhanced NK cell proliferation and activation, suggesting a role for MDSCs, probably G-MDSCs, in suppressing NK cell activation and function in vivo. We further demonstrate in vitro that G-MDSCs, but not M-MDSCs, are responsible for the suppression of NK cell activation. In addition, we show that adenoviral infection activated G-MDSCs to produce higher levels of reactive oxygen species (ROS) and that G-MDSC-mediated suppression of NK cells is mediated by ROS, specifically, H(2)O(2). This study demonstrates for the first time that the NK cell response to adenoviral vectors is negatively regulated by G-MDSCs and suggests that G-MDSC-based strategies could potentially improve the outcome of viral vector-mediated gene therapy.


Figures

Fig 1
Fig 1
Rapid accumulation of granulocytic MDSCs upon adenoviral infection. Mice were injected with Ad-LacZ intravenously (Ad) or left uninfected (Naïve). (A) At 12 h after infection, cells from spleen and bone marrow (BM) were stained with anti-Ly6G, anti-Ly6C, and anti-CD11b and subjected to fluorescence-activated cell sorter analysis. Fluorescence-activated cell sorter plots are shown, with the percentages of G-MDSCs (CD11b+ Ly6G+ Ly6Clo) and M-MDSCs (CD11b+ Ly6G Ly6Chi) indicated. Events were gated on CD11b+ cells. (B) At 0, 4, 12, 24, 48, and 72 h after infection, total mean numbers of G-MDSCs or M-MDSCs ± SDs from spleens and bone marrow of Ad-infected mice are shown (n = 3 per group). Results are representative of three independent experiments.
Fig 2
Fig 2
Depletion of G-MDSCs accelerates adenoviral clearance. Wild-type (WT) or RAG-2−/− mice were infected with Ad-LacZ intravenously (Ad) on day 0 or left uninfected (Naïve). Some Ad-infected mice were also treated with 100 μg of anti-Gr-1 antibody on days −1, 0, and +1 intravenously (Ad + Gr-1 Ab), an isotype control Ab (Ad + Isotype Ab), or 200 μg of gemcitabine on days 0 and +2 intraperitoneally (Ad + Gemcitabine). At 3 days after infection, spleen and liver tissues were harvested for analyses. (A) Splenocytes from wild-type mice were stained with anti-CD11b, anti-Ly6G, and anti-Ly6C antibodies and analyzed for the efficiency of MDSC depletion. The percentages of G-MDSCs (CD11b+ Ly6G+ Ly6Clo) and M-MDSCs (CD11b+ Ly6G Ly6Chi) among total cells are indicated. Events were gated on CD11b+ cells. (B) Liver cryosections were stained for LacZ expression by X-Gal histochemistry. (C) Total genomic DNA was isolated from the liver and analyzed for adenoviral DNA by quantitative real-time PCR; data represent the number of adenoviral genomic DNA copies per μg of liver DNA ± SD (n = 3 per group). (D) Total proteins from liver tissues were assayed for β-galactosidase (β-Gal) activity. Data represent β-galactosidase units per gram of liver protein ± SD (n = 3 per group). Results are representative of three independent experiments.
Fig 3
Fig 3
Depletion of G-MDSCs enhances NK cell proliferation. Mice were infected with Ad-LacZ intravenously (Ad) or left uninfected (Naïve). Some Ad-infected mice were also treated with anti-Gr-1 Ab (Ad + Gr-1 Ab) or gemcitabine (Ad + Gemcitabine), as described in the legend to Fig. 2. Mice were harvested at 24 h after infection. At 1 h prior to harvest, 2 mg of BrdU in 200 μl PBS was injected intraperitoneally into mice. (A) Splenocytes were stained with anti-DX5, anti-CD3ε, and anti-BrdU Abs. The percentage of BrdU-positive cells among DX5+ CD3ε NK cells is indicated. (B) The total number of splenic BrdU-positive NK cells ± SD is shown (n = 3 per group). Results are representative of three independent experiments.
Fig 4
Fig 4
Depletion of G-MDSCs promotes NK cell activation. Mice were infected with Ad-LacZ intravenously (Ad) or left uninfected (Naïve). Some Ad-infected mice were also treated with anti-Gr-1 Ab (Ad + Gr-1 Ab) or gemcitabine (Ad + Gemcitabine), as described in the legend to Fig. 2. At 24 h after infection, mice were harvested for analyses. (A) Splenocytes were stimulated for 4 h in the presence of PMA and ionomycin and assayed for intracellular IFN-γ and granzyme B production by NK cells. The percentage of IFN-γ- and granzyme B-positive cells among DX5+ CD3ε NK cells is indicated. (B) The total numbers of IFN-γ- or granzyme B-positive NK cells in the spleen or liver tissues ± SD are shown (n = 3 per group). Results are representative of three independent experiments.
Fig 5
Fig 5
G-MDSCs suppress NK cell activation. Purified DX5+ CD3 NK cells were cocultured with peritoneal macrophages and infected with Ad-LacZ (Ad) or left uninfected (Medium). In some wells, purified M-MDSCs (Ad + M-MDSC) or G-MDSCs (Ad + G-MDSC) were added to the coculture. At 18 h after infection, brefeldin A was added to the coculture, and cells were assayed 4 h later for intracellular IFN-γ and granzyme B production by NK cells. (A) Fluorescence-activated cell sorter plots show the percentage of IFN-γ- or granzyme B-positive cells among DX5+ CD3 NK cells. (B) The mean percentages of IFN-γ or granzyme B (Gzm)-positive cells ± SEMs among DX5+ CD3 NK cells are provided. The data shown are representative of three independent experiments.
Fig 6
Fig 6
Production of arginase-1, ROS, and iNOS by naïve and adenovirus-infected G-MDSCs. Mice were infected with Ad-LacZ (Ad) or left uninfected (Naïve). At 24 h after infection, purified G-MDSCs (G-MDSC) or CD8+ T cells (CD8) were used for the following analyses. (A) Cell lysates were analyzed for arginase-1 activity by measuring the ability to convert l-arginine to urea, as described in Materials and Methods. Data represent μg of urea per ml of cell lysates ± SD from three independent experiments. (B) ROS were determined by the production of fluorescent DCF, as described in Materials and Methods. The mean fluorescence intensity of DCF is indicated. (C) G-MDSCs were analyzed for intracellular iNOS expression by anti-iNOS Ab (iNOS) or an isotype control (Isotype), and the mean fluorescent intensity of iNOS staining is indicated. The data shown are representative of three independent experiments.
Fig 7
Fig 7
Suppression of NK cells by G-MDSCs is mediated by ROS. Purified DX5+ CD3 NK cells were cocultured with peritoneal macrophages and infected with Ad-LacZ (Ad) or left uninfected (Medium). In some wells, purified G-MDSCs (Ad + G-MDSC) were added to the coculture. In addition, where indicated, 0.5 μM l-NMMA, 0.5 μM l-NAME, 200 U/ml SOD, or 200 U/ml catalase was added to inhibit iNOS, arginase-1, O2 of the ROS, and H2O2 of the ROS, respectively. At 18 h after infection, brefeldin A was added to the coculture and cells were assayed 4 h later for intracellular IFN-γ and granzyme B production by NK cells. (A) Fluorescence-activated cell sorter plots of intracellular IFN-γ and granzyme B production by NK cells are shown, with the percentage of IFN-γ- or granzyme B-positive cells among DX5+ CD3 NK cells indicated. (B) The mean percentage of IFN-γ- or granzyme B-positive cells among DX5+ CD3 NK cells ± SD is provided. The data shown are representative of three independent experiments.

Similar articles

Cited by

References

    1. Bowen JL, Olson JK. 2009. Innate immune CD11b+Gr-1+ cells, suppressor cells, affect the immune response during Theiler's virus-induced demyelinating disease. J. Immunol. 183:6971–6980 - PubMed
    1. Condamine T, Gabrilovich DI. 2011. Molecular mechanisms regulating myeloid-derived suppressor cell differentiation and function. Trends Immunol. 32:19–25 - PMC - PubMed
    1. Corzo CA, et al. 2010. HIF-1alpha regulates function and differentiation of myeloid-derived suppressor cells in the tumor microenvironment. J. Exp. Med. 207:2439–2453 - PMC - PubMed
    1. Dai Y, et al. 1995. Cellular and humoral immune responses to adenoviral vectors containing factor IX gene: tolerization of factor IX and vector antigens allows for long-term expression. Proc. Natl. Acad. Sci. U. S. A. 92:1401–1405 - PMC - PubMed
    1. Delano MJ, et al. 2007. MyD88-dependent expansion of an immature GR-1(+)CD11b(+) population induces T cell suppression and Th2 polarization in sepsis. J. Exp. Med. 204:1463–1474 - PMC - PubMed

Publication types

LinkOut - more resources