. 2012 Nov 23;287(48):40560-9.
doi: 10.1074/jbc.M112.399576. Epub 2012 Oct 10.

Signaling-dependent phosphorylation of mitotic centromere-associated kinesin regulates microtubule depolymerization and its centrosomal localization

Affiliations

Signaling-dependent phosphorylation of mitotic centromere-associated kinesin regulates microtubule depolymerization and its centrosomal localization

Suresh B Pakala et al. J Biol Chem. .

Abstract

Background: Although PAK1 regulates cytoskeleton and microtubule dynamics, its role in controlling the functions of MCAK remains unknown.

Results: PAK1 phosphorylates MCAK and thereby regulates both its localization and function.

Conclusion: MCAK is a cognate substrate of PAK1.

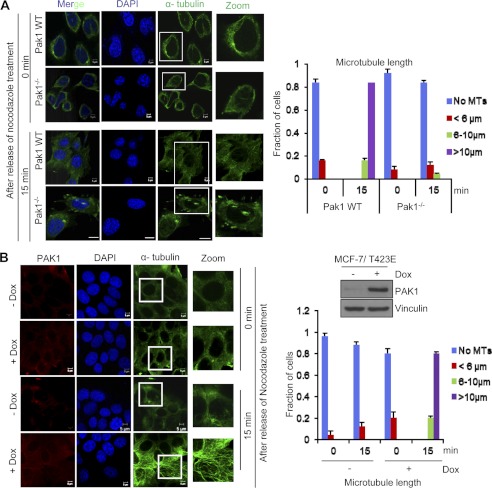
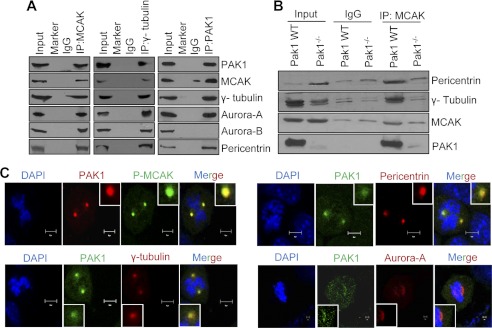
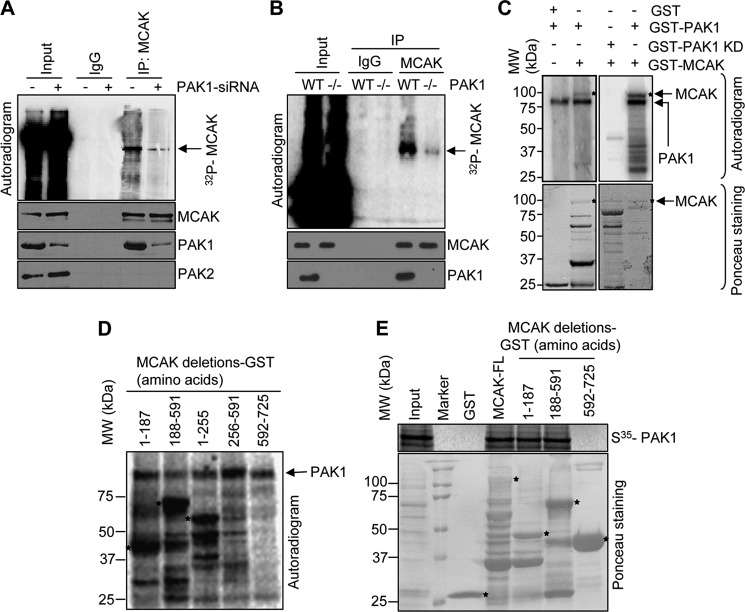
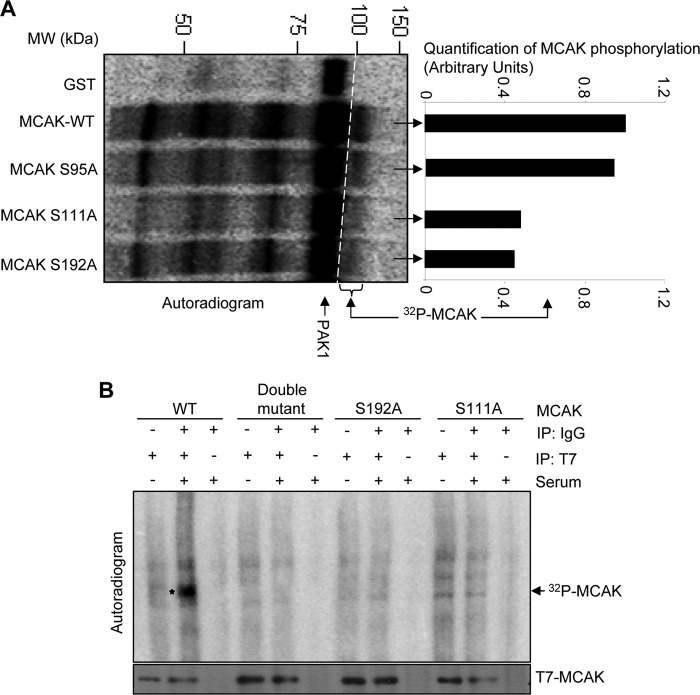
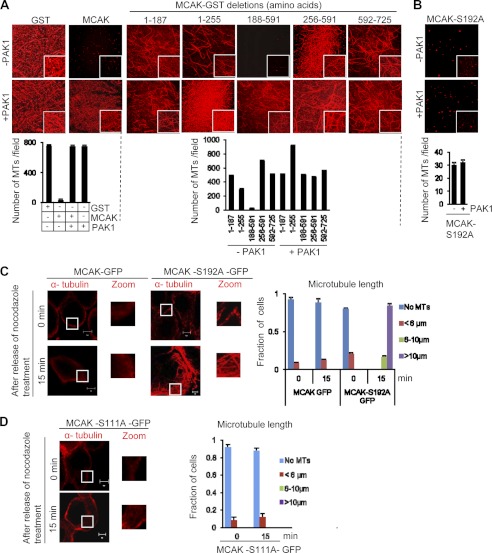
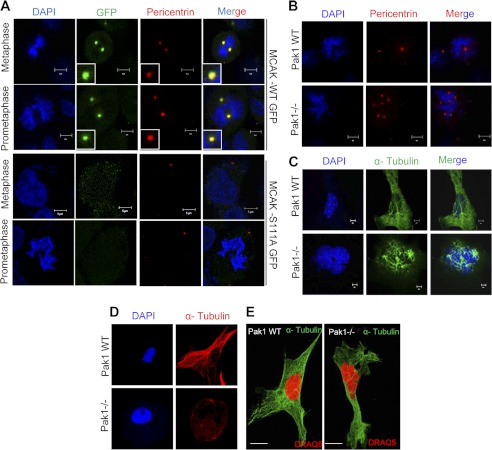
Significance: This study provides a novel mechanistic insight into PAK1 regulation of MCAK functions. Although p21-activated kinase 1 (PAK1) and microtubule (MT) dynamics regulate numerous fundamental processes including cytoskeleton remodeling, directional motility, and mitotic functions, the significance of PAK1 signaling in regulating the functions of MT-destabilizing protein mitotic centromere-associated kinesin (MCAK) remains unknown. Here we found that MCAK is a cognate substrate of PAK1 wherein PAK1 phosphorylates MCAK on serines 192 and 111 both in vivo and in vitro. Furthermore, we found that PAK1 phosphorylation of MCAK on serines 192 and 111 preferentially regulates its microtubule depolymerization activity and localization to centrosomes, respectively, in the mammalian cells.


Figures

FIGURE 1.
FIGURE 1.
Effect of PAK1 on MT dynamics. A, in vivo MT regrowth/polymerization in PAK1 wild-type (WT) and PAK1−/− MEFs. Cells were treated with nocodazole for 30 min, and after release at time intervals of 0 and 15 min, cells were fixed, stained with the indicated antibodies, and analyzed using confocal microscopy. The right side panel represents the graphical representation of the length of microtubules in each condition in 25 cells, and the y axis represents the fraction of cells representing the different lengths of microtubules scored. B, MCF-7/T423E cells in the presence and absence of doxycycline (Dox; 1 μg/ml) were treated with nocodazole for 30 min, and after release at time intervals of 0 and 15 min, cells were fixed, stained with the indicated antibodies, and the MT regrowth/polymerization was analyzed using confocal microscopy. The right side panel represents the graphical representation of the length of microtubules in each condition in 25 cells, and the y axis represents the fraction of cells with the different lengths of microtubules scored. Western blot analysis for PAK1 is provided to show the expression levels of PAK1 in MCF-7/T423E cells in the presence and absence of doxycycline. Error bars represent S.D. Scale bars = 5 μm.
FIGURE 2.
FIGURE 2.
PAK1 interacts with MCAK at the centrosomes. A, Western blot analysis of PAK1, MCAK, γ-tubulin, Aurora-A, Aurora-B, and pericentrin after immunoprecipitating (IP) with the indicated antibodies in the centrosomal proteins isolated from the synchronized ZR-75 cells. B, Western blot analysis for PAK1, MCAK, pericentrin, and γ-tubulin after immunoprecipitating with MCAK antibody in the centrosomal proteins isolated from the synchronized PAK1 wild-type and PAK1−/− MEFs. C, synchronized ZR-75 cells were released after 6 h and analyzed for the endogenous PAK1 localization with centrosomal proteins pericentrin, phospho-MCAK (P-MCAK), Aurora-A, and γ-tubulin by double immunofluorescence staining. The antibodies specific for the particular proteins were used for the staining. DAPI was used as a nuclear stain. Scale bars = 10 μm.
FIGURE 3.
FIGURE 3.
MCAK is a novel substrate of PAK1. A, in vivo phosphorylation of MCAK after PAK1 knockdown using PAK1-specific siRNA in ZR-75 cells. After treating the cells with PAK1 siRNA for 24 h, they were washed with PBS and incubated in serum-free medium for 24 h. After 24 h, the cells were changed to phosphate-free medium with sodium pyruvate and 2% dialyzed serum and labeled with [32P]orthophosphate (0.2 mCi/ml) for 6 h. After 6 h, cells were changed to complete medium containing 10% serum and kept for 6 h. The cells were then lysed and immunoprecipitated (IP) with the MCAK antibody, separated by SDS-PAGE, transferred onto nitrocellulose membrane, and analyzed by autoradiography. B, in vivo phosphorylation of MCAK in PAK1 wild-type and PAK1−/− MEFs. The assay was carried out as described in A. C, GST alone and MCAK-GST were used in an in vitro kinase assay with recombinant purified PAK1 and PAK1 kinase-dead enzyme. Asterisks in the upper panel represent the MCAK phosphorylation. The lower panel shows the Ponceau staining for the GST and MCAK-GST used in the reaction. Asterisks represent the MCAK-GST band. D, in vitro kinase assay was carried out with deletion constructs of MCAK-GST using recombinant purified PAK1 enzyme (PAK1-GST). Asterisks represent the phosphorylation of MCAK. E, in vitro translated 35S-labeled PAK1 was used to study its binding with GST, MCAK-GST, and its deletion constructs. The extent of binding was measured by signal intensity using autoradiography. The Ponceau-stained blot shows the equal amounts of GST proteins used in the reaction. Asterisks in the lower panel represents deletion constructs of MCAK-GST.
FIGURE 4.
FIGURE 4.
PAK1 phosphorylates MCAK at positions Ser-111 and Ser-192. A, in vitro kinase assay with MCAK-GST and its mutants using recombinant purified PAK1 enzyme (PAK1-GST). Phosphorylated MCAK was visualized by autoradiography. The right side panel represents the quantification analysis of MCAK phosphorylation using ImageJ software. B, in vivo kinase assay was carried out after transfecting the ZR-75 cells with either control vector, T7-PAK1, T7-MCAK, or its mutants. After transfection, cells were labeled with [32P]orthophosphate for 6 h in the presence and absence of serum. Cell lysates were then prepared, immunoprecipitated (IP) with the indicated antibodies, separated by SDS-PAGE, transferred onto nitrocellulose membrane, and visualized by autoradiography.
FIGURE 5.
FIGURE 5.
PAK1 phosphorylation of MCAK at position Ser-192 regulates its MT depolymerization activity. A, in vitro MT depolymerization activity of MCAK-GST and its deletion constructs in the presence of recombinant purified PAK1 enzyme (PAK1-GST). Rhodamine-labeled, GMPCPP-stabilized microtubules were incubated with MCAK-GST and its deletion constructs in the presence and absence of recombinant purified PAK1 enzyme for 5 min, and images were taken using confocal microscopy. The lower panel represents the quantification of in vitro MT depolymerization activity. For quantification, images were captured using the LSM-710 confocal microscope, and 25 images were taken for each time point. Representative figures from three individual experiments are shown here. For quantification, the number of microtubules per 71 × 56-μm fields from three individual micrographs for each sample were counted. The segmented line tool of the ImageJ software was used to draw a line across the length of the microtubules to get the exact length of the microtubules. Only microtubules greater than 6 μm were considered for analysis for each sample. Data represent mean ± S.D. of those samples. B, in vitro MT depolymerization activity of MCAK-S192A in the presence and absence of recombinant purified PAK1 enzyme. Rhodamine-labeled, GMPCPP-stabilized microtubules were incubated with MCAK-S192A-GST in the presence and absence of recombinant purified PAK1 for 5 min, and images were taken using confocal microscopy. The lower panel represents the quantification of in vitro MT depolymerization activity. The graph represents the number of microtubules per field in each condition. Error bars represent the mean of the S.D. C and D, in vivo MT depolymerization analysis using MCAK-GFP and its phosphorylation site mutants in mitotic ZR-75 cells. ZR-75 cells were transfected with MCAK-GFP, MCAK-S192A-GFP, or MCAK-S111A-GFP and treated with nocodazole (4 μg/ml). After 0- and 15-min release from nocodazole, cells were fixed, stained with the indicated antibodies, and analyzed using confocal microscopy. Microtubule length was scored in >25 cells per experiment. The graph shows the average of three independent experiments. Error bars represent S.D. Scale bars = 5 μm.
FIGURE 6.
FIGURE 6.
PAK1 phosphorylation of MCAK Ser-111 regulates its centrosomal localization. A, ZR-75 cells transfected with GFP, MCAK-GFP, and MCAK-S111A-GFP were synchronized with double thymidine (2 nm) to the mitotic stage, and centrosomal localization of MCAK was analyzed using confocal microscopy. Anti-pericentrin antibody was used to stain for centrosomes, and DAPI was used as the counterstain. B, abnormal centrioles in PAK1−/− MEFs compared with PAK1 wild-type MEFs. PAK1 wild-type and PAK1−/− MEFs were stained for pericentrin (red), and nuclei were stained with DAPI (blue). C, multiple spindle formation observed in PAK1−/− MEFs compared with PAK1 wild-type MEFs. The PAK1 wild-type and PAK1−/− cells were stained with α-tubulin (green), and nuclei were stained with DAPI. D, long microtubules in PAK1 wild-type MEFs compared with PAK1−/− MEFs. PAK1 wild-type and PAK1−/− MEFs were stained for α-tubulin (red), and nuclei were stained with DAPI (blue). E, multinucleated cells combined with defective MT dynamics were observed in PAK1−/− MEFs compared with PAK1 wild-type MEFs using super-resolution microscopy. The nuclei were stained with DRAQ5 (red). The cells were stained with α-tubulin (green). Scale bars = 5 μm.

Similar articles

Cited by

References

    1. Manning A. L., Ganem N. J., Bakhoum S. F., Wagenbach M., Wordeman L., Compton D. A. (2007) The kinesin-13 proteins Kif2a, Kif2b, and Kif2c/MCAK have distinct roles during mitosis in human cells. Mol. Biol. Cell 18, 2970–2979 - PMC - PubMed
    1. Maney T., Wagenbach M., Wordeman L. (2001) Molecular dissection of the microtubule depolymerizing activity of mitotic centromere-associated kinesin. J. Biol. Chem. 276, 34753–34758 - PubMed
    1. Maney T., Hunter A. W., Wagenbach M., Wordeman L. (1998) Mitotic centromere-associated kinesin is important for anaphase chromosome segregation. J. Cell Biol. 142, 787–801 - PMC - PubMed
    1. Wordeman L., Mitchison T. J. (1995) Identification and partial characterization of mitotic centromere-associated kinesin, a kinesin-related protein that associates with centromeres during mitosis. J. Cell Biol. 128, 95–104 - PMC - PubMed
    1. Zhang X., Ems-McClung S. C., Walczak C. E. (2008) Aurora-A phosphorylates MCAK to control ran-dependent spindle bipolarity. Mol. Biol. Cell 19, 2752–2765 - PMC - PubMed

Publication types