. 2012 Dec;40(22):11363-79.
doi: 10.1093/nar/gks868. Epub 2012 Oct 2.

SPOC1 modulates DNA repair by regulating key determinants of chromatin compaction and DNA damage response

Affiliations

SPOC1 modulates DNA repair by regulating key determinants of chromatin compaction and DNA damage response

Andreas Mund et al. Nucleic Acids Res. 2012 Dec.

Erratum in

Abstract

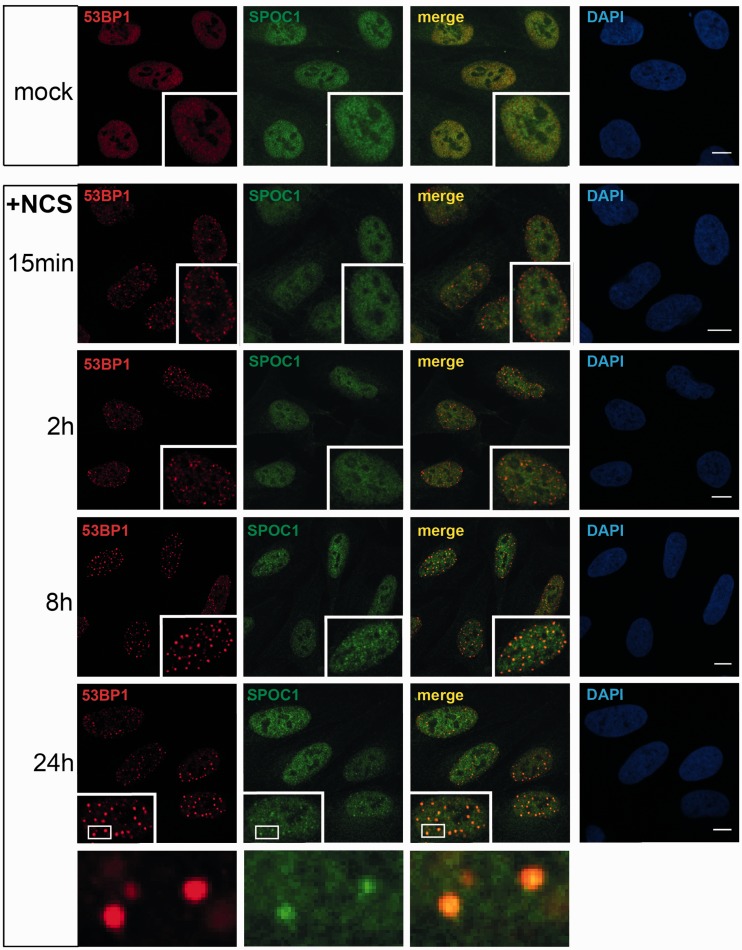
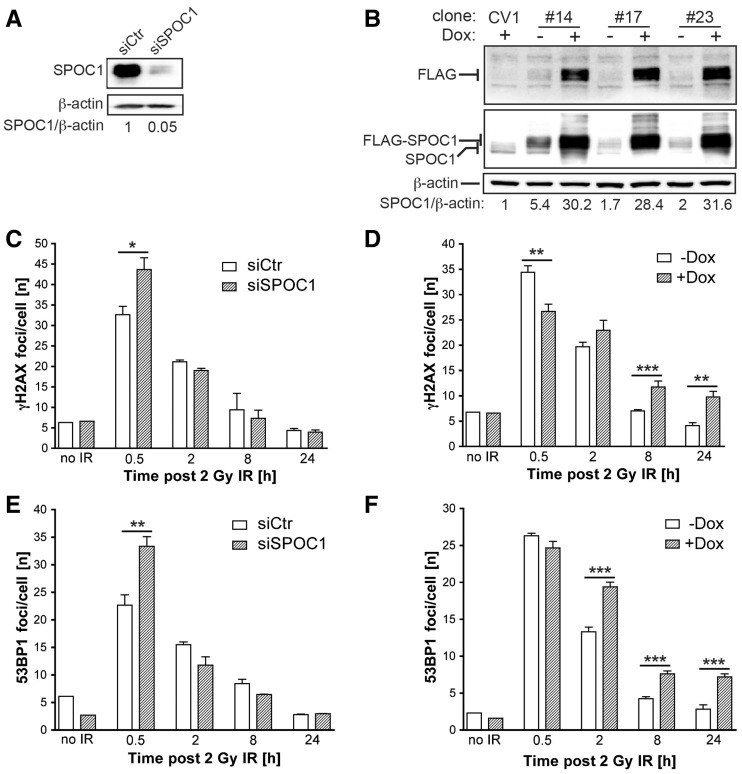
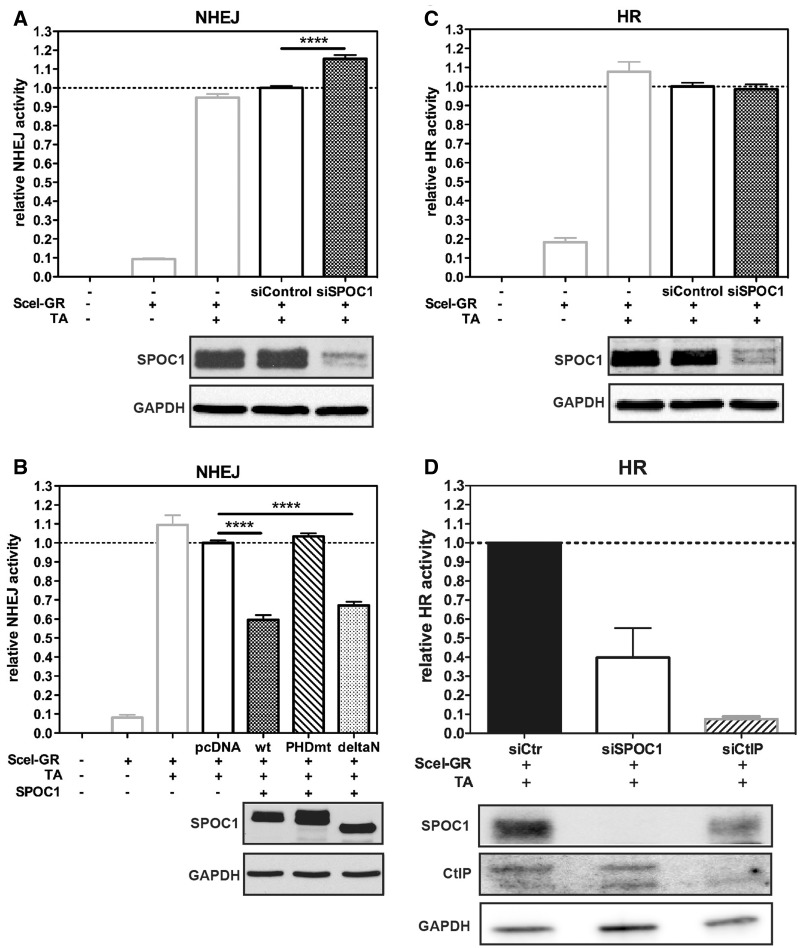
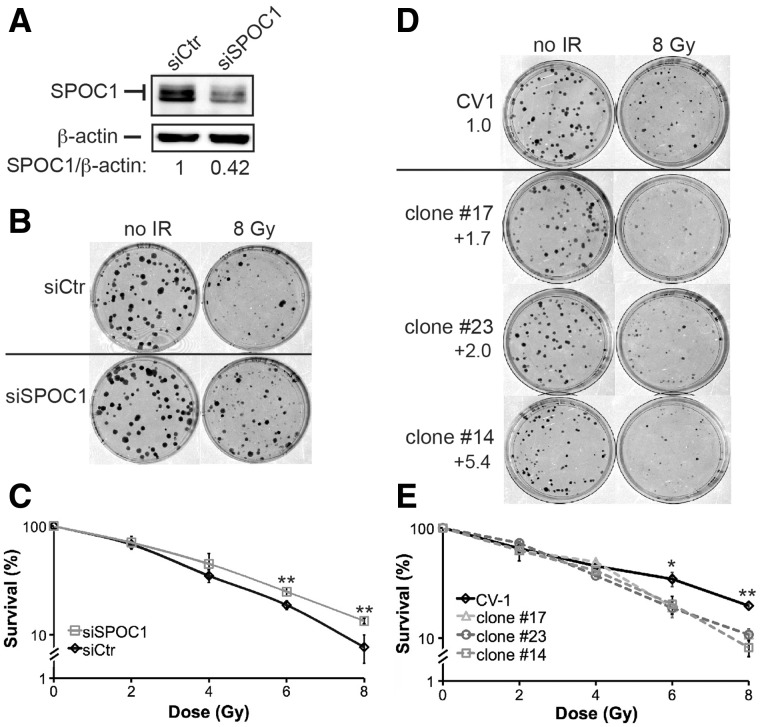
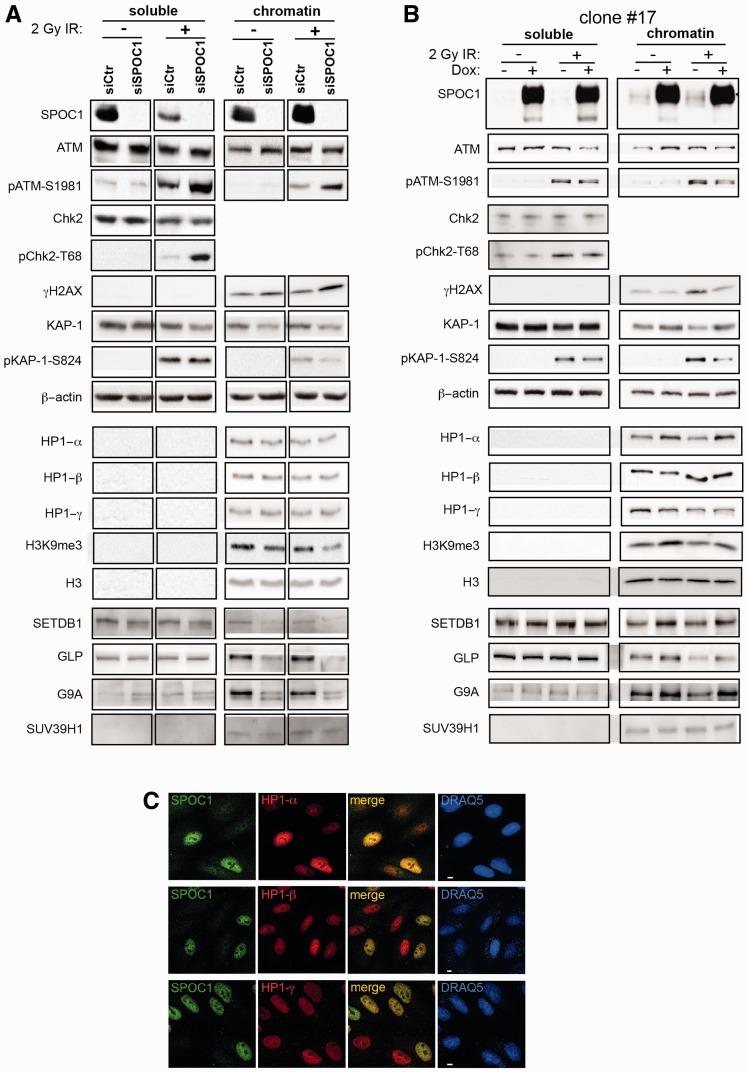
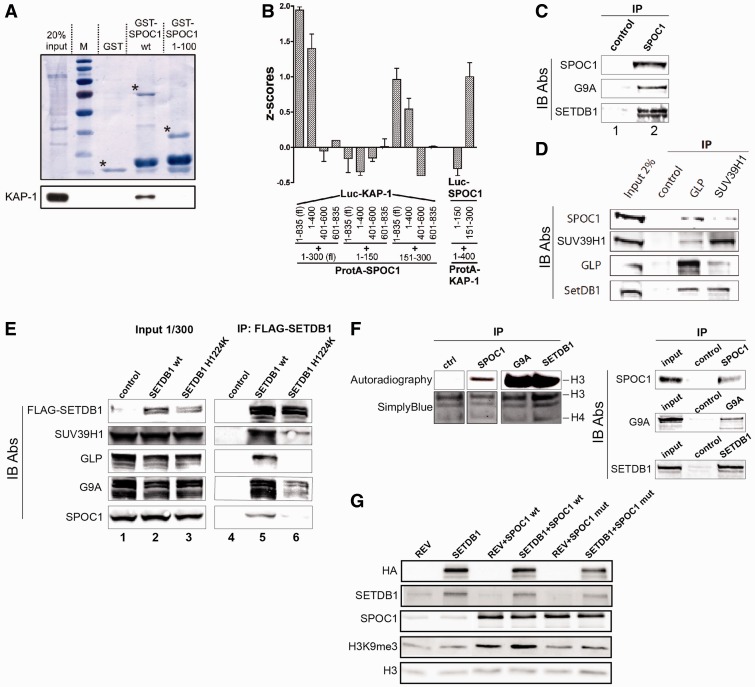
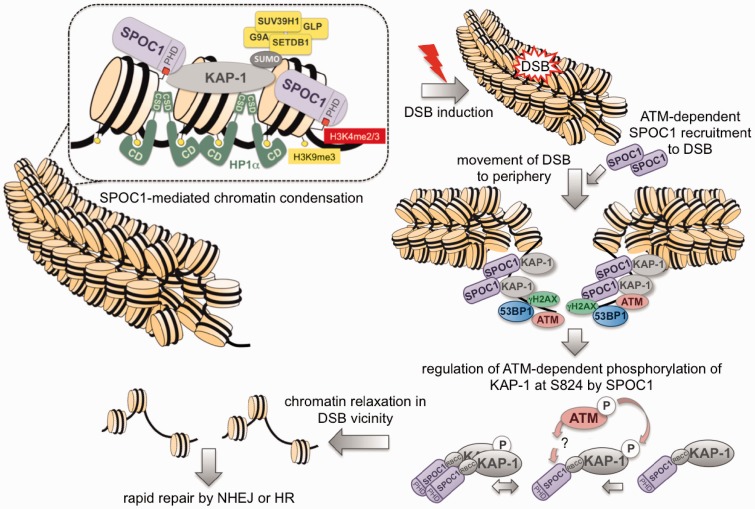
Survival time-associated plant homeodomain (PHD) finger protein in Ovarian Cancer 1 (SPOC1, also known as PHF13) is known to modulate chromatin structure and is essential for testicular stem-cell differentiation. Here we show that SPOC1 is recruited to DNA double-strand breaks (DSBs) in an ATM-dependent manner. Moreover, SPOC1 localizes at endogenous repair foci, including OPT domains and accumulates at large DSB repair foci characteristic for delayed repair at heterochromatic sites. SPOC1 depletion enhances the kinetics of ionizing radiation-induced foci (IRIF) formation after γ-irradiation (γ-IR), non-homologous end-joining (NHEJ) repair activity, and cellular radioresistance, but impairs homologous recombination (HR) repair. Conversely, SPOC1 overexpression delays IRIF formation and γH2AX expansion, reduces NHEJ repair activity and enhances cellular radiosensitivity. SPOC1 mediates dose-dependent changes in chromatin association of DNA compaction factors KAP-1, HP1-α and H3K9 methyltransferases (KMT) GLP, G9A and SETDB1. In addition, SPOC1 interacts with KAP-1 and H3K9 KMTs, inhibits KAP-1 phosphorylation and enhances H3K9 trimethylation. These findings provide the first evidence for a function of SPOC1 in DNA damage response (DDR) and repair. SPOC1 acts as a modulator of repair kinetics and choice of pathways. This involves its dose-dependent effects on DNA damage sensors, repair mediators and key regulators of chromatin structure.


Figures

Figure 1.
Figure 1.
SPOC1 is recruited to I-SceI-induced DSBs where it colocalizes with 53BP1. (A) In situ immunofluorescence studies with U2OS19 ptight13 GFP-LacR cells with a stably integrated I-SceI cleavage site flanked by lac operator repeats reveals localization of the GFP-lac repressor protein (GFP-LacR) at the lac-operator DNA sequences in the nucleus before (−I-SceI) and 16 h after I-SceI-induced (+ I-SceI) DSB. In contrast, SPOC1 (white) and 53BP1 (red) are distributed throughout the nucleus in the absence of I-Scel, and partially colocalized in naturally occurring repair foci. After I-SceI cleavage to generate DSBs, SPOC1 and 53BP1 colocalize at distinct foci, including the cleaved DNA adjacent to DNA-bound GFP-LacR. Proteins were visualized by immunostaining and confocal microscopy. Scale bars = 10 μm. (B) Quantitative analysis of SPOC1 recruitment to the 53BP1 and GFP-LacR positive lacO array before and 16 h after I-SceI induction. (C) Monitoring of the kinetics of SPOC1 and 53BP1 recruitment to DSBs between 0 and 24 h post-I-SceI induction. (D) Quantifying ATM kinase inhibitor-mediated effects on recruitment of SPOC1 and 53BP1 to DSBs as evident 16 h after I-SceI-induced cleavage. (E) SPOC1 and 53BP1 colocalize at a large discrete endogenous repair focus as observed in some non-irradiated U2OS cells by immunostaining. Scale bar = 10µm.
Figure 2.
Figure 2.
Comparative kinetics of 53BP1 and SPOC1 recruitment to radiomimetic drug NCS-induced DSBs. U2OS cells fixed before (mock) or at the indicated times post-treatment (+NCS), immunostained for SPOC1 (green) and 53BP1 (red) and analyzed by confocal microcopy. At the earliest observation period after NCS treatment (15 min) a large number of small 53BP1 stained DSB repair foci emerged, but were not detectably stained by SPOC1. Between 2 to 24 h post-NCS treatment the number of small 53BP1 stained foci gradually, then almost completely disappeared, concomitant with emerging larger repair foci. At around 8 h post-NCS treatment most of the large 53BP1-stained repair foci were also strongly stained by SPOC1, suggesting SPOC1 is recruited to and accumulates at DSBs in heterochromatin known for their slow repair kinetics. Scale bars = 10µm.
Figure 3.
Figure 3.
SPOC1 dose-dependent modulation of DDR after γ-IR. SPOC1 expression in CV1 cell lines was determined by immunoblotting cell extracts with the indicated antibodies (Supplementary Information). (A) SPOC1 protein levels 72 h post-siRNA transfection; (B) Endogenous and FLAG-SPOC1 expression in three stably transformed CV1 cell lines (clones #14, #17 and #23) pre- or 24 h post-Dox treatment. Signals were quantified by densitometry. (C–F) IRIF visualized by indirect immunofluorescence of CV1 cells (unpublished observations) were counted by automated imaging at various times after γ-irradiation. (C, E) γH2AX and 53BP1 foci in CV1 cells 72 h after siRNA-mediated reduction of SPOC1 (siSPOC1) compared to control cells (siCtr). (D, F) γH2AX and 53BP1 IRIF in CV1 clone #14 before and after Dox-induced (24 h) expression of FLAG-SPOC1. The IRIF of 700–1000 cells were counted in each of three independent radiation experiments and at different time points, and are represented as the mean/cell ± SEM. *P ≤ 0.05, **P ≤ 0.01, ***P≤ 0.001.
Figure 4.
Figure 4.
SPOC1-expression levels modulate NHEJ activity. (A) siRNA-mediated SPOC1 depletion increases NHEJ activity in H1299.EJ reporter cells compared to control siRNA-transfected cells as quantified by flow cytometry detecting EGFP expression. NHEJ activity is only evident after I-Scel-mediated cleavage in cells transfected with a plasmid expressing cytoplasmic SceI fused to glucocorticoid receptor ligand-binding domain (SceI-GR), plus TA to translocate the fusion protein into the nucleus. (B) Enhanced expression of SPOC1wt and a SPOC1 N-terminal domain deletion (deltaN), but not a PHD-deficient derivative (PHDmt) strongly reduced NHEJ activity when analyzed and quantified as in (A). (C) DNA repair activity by HR in H1299.GC reporter cells after SPOC1 siRNA or control siRNA transfection, quantified as in (A), were similar. (D) HR-mediated DNA repair activity in U2OS-DR-GFP reporter cells was reduced by >60% after siRNA-induced SPOC1 knockdown compared to control siRNA treated cells. Knockdown of CtIP, a protein critical for the initial steps of HR, reduced HR activity by ∼90% compared to the control siRNA transfected cells. All data are from triplicates derived from three independent experiments (±SEM) ****P ≤ 0.0001. (A–D) Successful SPOC1 and CtIP knockdown as well as equivalent expression levels of SPOC1 wt and mutant proteins were confirmed by immunoblotting of cell extracts using anti-SPOC1, anti-CtIP and anti-GAPDH antibodies.
Figure 5.
Figure 5.
SPOC1 protein expression levels affect cell survival after γ-IR. (A) Immunoblot analysis shows that SPOC1 levels in SPOC1 siRNA transfected CV1 cells are reduced by 58% compared to control siRNA-transfected cells as analyzed by densitometry. These cells were used for clonogenic survival assays (see below). (B) Colony formation assays: SPOC1-siRNA treated cells formed more colonies than control siRNA transfected cells when analyzed after 8 Gy γ-IR and 9 days post-plating, indicating higher radioresistence. (C) Survival curves based on clonogenic growth of CV1 cells transfected with SPOC1-siRNA or control siRNA, analyzed after 0–8 Gy γ-IR and up to 9 days after plating. SPOC1 knockdown results in increased radioresistance. (D) Colony formation assays: different SPOC1 overexpressing (1.7- to 5.4-fold) cell lines formed less colonies than control cells when analyzed after 8 Gy γ-IR and 12 days post-plating, indicating higher radiosensitivity. (E) Survival curves based on clonogenic growth of SPOC1 overexpressing (1.7- to 5.4-fold) or control cells after 0–8 Gy γ-IR and analyzed 12 days after plating. SPOC1 overexpression results in lower radioresistance. Cells were plated in two different densities and in triplicates. Mean values ± SD are given. *P ≤ 0.05; **P ≤ 0.01.
Figure 6.
Figure 6.
SPOC1 levels modify expression, modification and localization of proteins involved in chromatin (de)compaction and DDR. Immunoblots of soluble and chromatin-rich fractions from untreated (−) and irradiated cells collected 30 min post-2 Gy γ-IR (+) analyzed with Abs against the indicated proteins. (A) SPOC1-siRNA transfected cells show less SPOC1 protein than control CV1 cells. (B) Dox-treatment strongly enhances SPOC1 levels in CV1 cell line clone #17. (A and B) Immunoblot signal intensities for different cellular proteins detected in the corresponding cellular lysates show specific changes in expression of some but not all, depending on the soluble or chromatin fraction, SPOC1-expression levels and/or γ-IR. (C) Confocal immunofluorescence analysis of mixed CV1 cells over and underexpressing SPOC1 immunostained for HP1-α (top), HP1-β (middle) and HP1-γ (lower panels) only showed enhanced HP1-α expression in SPOC1-overexpressing cells. SPOC1 was immunostained with antibody CR56, the HP1 proteins with the antibodies given in ‘Materials and Methods’ section, and DNA was stained by DRAQ5. Scale bars = 5 μm.
Figure 7.
Figure 7.
SPOC1 protein interacts with KAP-1 and enzymatically active H3K9 KMTs. (A) In GST-pulldown experiments with GST-SPOC1 wt, GST-SPOC1 (amino acids 1–100) or GST alone and chromatin extracts from U2OS cells, only the GST-SPOC1-full-length protein precipitated the KAP-1 protein, as detected on the immunoblot (lower panel). Amounts of GST proteins used were visualized by Amido black staining of the blots (upper panel). Asterisks mark the positions of full-length GST-proteins. (B) LUMIER-assay for mapping the KAP-1/SPOC1 interaction. The indicated combinations of SPOC1 and KAP-1, ProteinA (ProtA) and luciferase (Luc) fusion proteins were coexpressed. Luc activity coprecipitated with IgG-beads was measured (Z-scores). Significant KAP-1-interaction is only evident between both full-length proteins, or the C-terminal half of SPOC1 and the N-terminal 400 amino acids of KAP1, as detected by significant Luc activity in the corresponding pellets. Z-score ≥ 0.5 indicates an interaction. Mean values ± SD of three independent experiments each performed in triplicate are given. (C) Immunoprecipitation of SPOC1 from HeLa nuclear extracts with anti-SPOC1 (lane 2) or with control antibodies (lane 1) and analysis of pelleted material by immunoblotting shows specific coprecipitation of G9a and SETDB1 with SPOC1. (D) Immunoprecipitation (IP) of endogenous GLP or SUV39H1 from C2C12 cell extracts and immunoblotting with the indicated Abs (IB Abs) against GLP (PP-B0422-00), SUV39H1 (07-550), SETDB1 (ab12317) and SPOC1 (6F6). Unlike the control Ab, GLP and SUV39H1 Abs precipitated all associated KMTs as well as SPOC1. (E) Nuclear extracts of control C2C12 cells (lane 1) or cells expressing HA-FLAG-tagged SETDB1 wt (lane 2) or SETDB1 H1224K mutant (lane 3) were analyzed on immunoblots (IB Ab.) with antibodies against FLAG (F1804), G9A (D141-3), GLP (PP-B0422-00), SUV39H1 (07-550) and SPOC1 (6F6). After anti-FLAG-SETDB1 immunoprecipitation (IP) the immunoblot detected specific coprecipitation of SPOC1 by wt SETDB1 (lane 5) but much less by enzymatically inactive SETDB1 H1224K (lane 6). (F) In vitro analysis of histone H3 methlylation by proteins immunoprecipitated by control, SPOC1, G9A, or SETDB1 antibodies. Left panel: autoradiography and SimplyBlue staining of the assay products separated by SDS–PAGE. Right panel: immunoblot which demonstrates that SPOC1, G9A and SETDB1 were immunoprecipitated specifically from the HeLa nuclear extracts. (G) In total lysates from HeLa-S3 cell lines constitutively expressing HA-FLAG-SETDB1 (HA-SETDB1), lentiviral-mediated SPOC1wt expression elevates H3K9me3 levels compared to control cells (REV), as detected by immunblotting with Abs against the indicated proteins (left). The SPOC1 PHD mutant (SPOC1mut) unable to bind to H3K4me3 only marginally increased H3K9me3 levels compared to SPOC1 wt.
Figure 8.
Figure 8.
Model: mechanisms of SPOC1-associated chromatin compaction and modulation of DDR at DSBs. The interaction of SPOC1 with heterochromatin building factors KAP-1, HP1 and H3K9 KMTs and its binding to chromatin via H3K4me2/3 and/or other factors can induce chromatin compaction. DNA damage-induced DSBs in heterochromatin activate ATM kinase. This results in pan-nuclear KAP-1S824 phosphorylation and concomitant ATM recruitment to repair foci, and also to increasing accumulation at repair foci. SPOC1 is also ATM-dependently recruited to DSBs and accumulates detectably only at heterochromatic repair foci after γ-H2AX expansion and 53BP1 accumulation. The KAP-1S824 phosphorylation required for chromatin relaxation at DSBs in heterochromatin and for DNA repair is regulated by SPOC1. For more details see text.

Similar articles

Cited by

References

    1. Mohrmann G, Hengstler JG, Hofmann TG, Endele SU, Lee B, Stelzer C, Zabel B, Brieger J, Hasenclever D, Tanner B, et al. SPOC1, a novel PHD-finger protein: association with residual disease and survival in ovarian cancer. Int. J. Cancer. 2005;116:547–554. - PubMed
    1. Kinkley S, Staege H, Mohrmann G, Rohaly G, Schaub T, Kremmer E, Winterpacht A, Will H. SPOC1: a novel PHD-containing protein modulating chromatin structure and mitotic chromosome condensation. J. Cell Sci. 2009;122:2946–2956. - PubMed
    1. Chi P, Allis CD, Wang GG. Covalent histone modifications–miswritten, misinterpreted and mis-erased in human cancers. Nat. Rev. Cancer. 2010;10:457–469. - PMC - PubMed
    1. Bordlein A, Scherthan H, Nelkenbrecher C, Molter T, Bosl MR, Dippold C, Birke K, Kinkley S, Staege H, Will H, et al. SPOC1 (PHF13) is required for spermatogonial stem cell differentiation and sustained spermatogenesis. J. Cell Sci. 2011;124:3137–3148. - PubMed
    1. Schuster-Bockler B, Lehner B. Chromatin organization is a major influence on regional mutation rates in human cancer cells. Nature. 2012;488:504–507. - PubMed

Publication types