Population diversity of ORFan genes in Escherichia coli
- PMID: 23034216
- PMCID: PMC3514957
- DOI: 10.1093/gbe/evs081
Population diversity of ORFan genes in Escherichia coli
Abstract
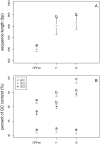
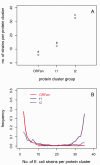
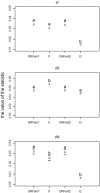
The origin and evolution of "ORFans" (suspected genes without known relatives) remain unclear. Here, we take advantage of a unique opportunity to examine the population diversity of thousands of ORFans, based on a collection of 35 complete genomes of isolates of Escherichia coli and Shigella (which is included phylogenetically within E. coli). As expected from previous studies, ORFans are shorter and AT-richer in sequence than non-ORFans. We find that ORFans often are very narrowly distributed: the most common pattern is for an ORFan to be found in only one genome. We compared within-species population diversity of ORFan genes with those of two control groups of non-ORFan genes. Patterns of population variation suggest that most ORFans are not artifacts, but encode real genes whose protein-coding capacity is conserved, reflecting selection against nonsynonymous mutations. Nevertheless, nonsynonymous nucleotide diversity is higher than for non-ORFans, whereas synonymous diversity is roughly the same. In particular, there is a several-fold excess of ORFans in the highest decile of diversity relative to controls, which might be due to weaker purifying selection, positive selection, or a subclass of ORFans that are decaying.
Figures


Similar articles
-
Bacterial genomes as new gene homes: the genealogy of ORFans in E. coli.Genome Res. 2004 Jun;14(6):1036-42. doi: 10.1101/gr.2231904. Genome Res. 2004. PMID: 15173110 Free PMC article.
-
Structural features and the persistence of acquired proteins.Proteomics. 2008 Nov;8(22):4772-81. doi: 10.1002/pmic.200800061. Proteomics. 2008. PMID: 18924109 Free PMC article.
-
Identification and investigation of ORFans in the viral world.BMC Genomics. 2008 Jan 19;9:24. doi: 10.1186/1471-2164-9-24. BMC Genomics. 2008. PMID: 18205946 Free PMC article.
-
Twenty thousand ORFan microbial protein families for the biologist?Structure. 2003 Jan;11(1):7-9. doi: 10.1016/s0969-2126(02)00938-3. Structure. 2003. PMID: 12517334 Review.
-
The evolution of the Escherichia coli phylogeny.Infect Genet Evol. 2012 Mar;12(2):214-26. doi: 10.1016/j.meegid.2012.01.005. Epub 2012 Jan 14. Infect Genet Evol. 2012. PMID: 22266241 Review.
Cited by
-
Taxonomically Restricted Genes in Bacillus may Form Clusters of Homologs and Can be Traced to a Large Reservoir of Noncoding Sequences.Genome Biol Evol. 2023 Mar 3;15(3):evad023. doi: 10.1093/gbe/evad023. Genome Biol Evol. 2023. PMID: 36790099 Free PMC article.
-
Orphan Genes Shared by Pathogenic Genomes Are More Associated with Bacterial Pathogenicity.mSystems. 2019 Feb 12;4(1):e00290-18. doi: 10.1128/mSystems.00290-18. eCollection 2019 Jan-Feb. mSystems. 2019. PMID: 30801025 Free PMC article.
-
Stable-Isotope Probing of Human and Animal Microbiome Function.Trends Microbiol. 2018 Dec;26(12):999-1007. doi: 10.1016/j.tim.2018.06.004. Epub 2018 Jul 9. Trends Microbiol. 2018. PMID: 30001854 Free PMC article. Review.
-
ORFanFinder: automated identification of taxonomically restricted orphan genes.Bioinformatics. 2016 Jul 1;32(13):2053-5. doi: 10.1093/bioinformatics/btw122. Epub 2016 Mar 7. Bioinformatics. 2016. PMID: 27153690 Free PMC article.
-
Elucidating the functional roles of prokaryotic proteins using big data and artificial intelligence.FEMS Microbiol Rev. 2023 Jan 16;47(1):fuad003. doi: 10.1093/femsre/fuad003. FEMS Microbiol Rev. 2023. PMID: 36725215 Free PMC article. Review.
References
-
- Awano T, et al. A frame shift mutation in canine TPP1 (the ortholog of human CLN2) in a juvenile dachshund with neuronal ceroid lipofuscinosis. Mol Genet Metabol. 2006;89:254–260. - PubMed
-
- Benson MD, et al. A new human hereditary amyloidosis: the result of a stop-codon mutation in the apolipoprotein AII gene. Genomics. 2001;72:272–277. - PubMed
-
- Charlebois RL, Clarke GD, Beiko RG, Jean A. Characterization of species-specific genes using a flexible, Web-based querying system. FEMS Microbiol Lett. 2003;225:213–220. - PubMed
Publication types
MeSH terms
Grants and funding
LinkOut - more resources
Full Text Sources
Research Materials

