A comparison of brain gene expression levels in domesticated and wild animals
- PMID: 23028369
- PMCID: PMC3459979
- DOI: 10.1371/journal.pgen.1002962
A comparison of brain gene expression levels in domesticated and wild animals
Abstract
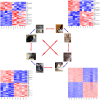
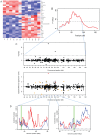
Domestication has led to similar changes in morphology and behavior in several animal species, raising the question whether similarities between different domestication events also exist at the molecular level. We used mRNA sequencing to analyze genome-wide gene expression patterns in brain frontal cortex in three pairs of domesticated and wild species (dogs and wolves, pigs and wild boars, and domesticated and wild rabbits). We compared the expression differences with those between domesticated guinea pigs and a distant wild relative (Cavia aperea) as well as between two lines of rats selected for tameness or aggression towards humans. There were few gene expression differences between domesticated and wild dogs, pigs, and rabbits (30-75 genes (less than 1%) of expressed genes were differentially expressed), while guinea pigs and C. aperea differed more strongly. Almost no overlap was found between the genes with differential expression in the different domestication events. In addition, joint analyses of all domesticated and wild samples provided only suggestive evidence for the existence of a small group of genes that changed their expression in a similar fashion in different domesticated species. The most extreme of these shared expression changes include up-regulation in domesticates of SOX6 and PROM1, two modulators of brain development. There was almost no overlap between gene expression in domesticated animals and the tame and aggressive rats. However, two of the genes with the strongest expression differences between the rats (DLL3 and DHDH) were located in a genomic region associated with tameness and aggression, suggesting a role in influencing tameness. In summary, the majority of brain gene expression changes in domesticated animals are specific to the given domestication event, suggesting that the causative variants of behavioral domestication traits may likewise be different.
Conflict of interest statement
The authors have declared that no competing interests exist.
Figures


Similar articles
-
The behavioral endocrinology of domestication: A comparison between the domestic guinea pig (Cavia aperea f. porcellus) and its wild ancestor, the cavy (Cavia aperea).Horm Behav. 1999 Feb;35(1):28-37. doi: 10.1006/hbeh.1998.1493. Horm Behav. 1999. PMID: 10049600
-
Molecular microevolution and epigenetic patterns of the long non-coding gene H19 show its potential function in pig domestication and breed divergence.BMC Evol Biol. 2016 Apr 23;16:87. doi: 10.1186/s12862-016-0657-5. BMC Evol Biol. 2016. PMID: 27107967 Free PMC article.
-
Facial shape differences between rats selected for tame and aggressive behaviors.PLoS One. 2017 Apr 3;12(4):e0175043. doi: 10.1371/journal.pone.0175043. eCollection 2017. PLoS One. 2017. PMID: 28369080 Free PMC article.
-
Of domestic and wild guinea pigs: studies in sociophysiology, domestication, and social evolution.Naturwissenschaften. 1998 Jul;85(7):307-17. doi: 10.1007/s001140050507. Naturwissenschaften. 1998. PMID: 9722963 Review.
-
Are domesticated animals dumber than their wild relatives? A comprehensive review on the domestication effects on animal cognitive performance.Neurosci Biobehav Rev. 2023 Nov;154:105407. doi: 10.1016/j.neubiorev.2023.105407. Epub 2023 Sep 26. Neurosci Biobehav Rev. 2023. PMID: 37769929 Review.
Cited by
-
The Domestication of Wild Boar Could Result in a Relaxed Selection for Maintaining Olfactory Capacity.Life (Basel). 2024 Aug 22;14(8):1045. doi: 10.3390/life14081045. Life (Basel). 2024. PMID: 39202786 Free PMC article.
-
On taming the effect of transcript level intra-condition count variation during differential expression analysis: A story of dogs, foxes and wolves.PLoS One. 2022 Sep 22;17(9):e0274591. doi: 10.1371/journal.pone.0274591. eCollection 2022. PLoS One. 2022. PMID: 36136981 Free PMC article.
-
Population and sex differences in Drosophila melanogaster brain gene expression.BMC Genomics. 2012 Nov 21;13:654. doi: 10.1186/1471-2164-13-654. BMC Genomics. 2012. PMID: 23170910 Free PMC article.
-
Genomic responses to selection for tame/aggressive behaviors in the silver fox (Vulpes vulpes).Proc Natl Acad Sci U S A. 2018 Oct 9;115(41):10398-10403. doi: 10.1073/pnas.1800889115. Epub 2018 Sep 18. Proc Natl Acad Sci U S A. 2018. PMID: 30228118 Free PMC article.
-
Analysis of the canine brain transcriptome with an emphasis on the hypothalamus and cerebral cortex.Mamm Genome. 2013 Dec;24(11-12):484-99. doi: 10.1007/s00335-013-9480-0. Epub 2013 Nov 8. Mamm Genome. 2013. PMID: 24202129
References
-
- Diamond J (2002) Evolution, consequences and future of plant and animal domestication. Nature 418: 700–707. - PubMed
-
- Price EO (1999) Behavioral development in animals undergoing domestication. Applied Animal Behaviour Science 65: 245–271.
-
- Larson G (2011) Genetics and Domestication. Current Anthropology 52.
Publication types
MeSH terms
Substances
Grants and funding
LinkOut - more resources
Full Text Sources
Medical
Research Materials

