. 2012 Sep;8(9):e1002934.
doi: 10.1371/journal.pgen.1002934. Epub 2012 Sep 13.

Citrullination of histone H3 interferes with HP1-mediated transcriptional repression

Affiliations

Citrullination of histone H3 interferes with HP1-mediated transcriptional repression

Priyanka Sharma et al. PLoS Genet. 2012 Sep.

Abstract

Multiple Sclerosis (MS) is an autoimmune disease associated with abnormal expression of a subset of cytokines, resulting in inappropriate T-lymphocyte activation and uncontrolled immune response. A key issue in the field is the need to understand why these cytokines are transcriptionally activated in the patients. Here, we have examined several transcription units subject to pathological reactivation in MS, including the TNFα and IL8 cytokine genes and also several Human Endogenous RetroViruses (HERVs). We find that both the immune genes and the HERVs require the heterochromatin protein HP1α for their transcriptional repression. We further show that the Peptidylarginine Deiminase 4 (PADI4), an enzyme with a suspected role in MS, weakens the binding of HP1α to tri-methylated histone H3 lysine 9 by citrullinating histone H3 arginine 8. The resulting de-repression of both cytokines and HERVs can be reversed with the PADI-inhibitor Cl-amidine. Finally, we show that in peripheral blood mononuclear cells (PBMCs) from MS patients, the promoters of TNFα, and several HERVs share a deficit in HP1α recruitment and an augmented accumulation of histone H3 with a double citrulline 8 tri-methyl lysine 9 modifications. Thus, our study provides compelling evidence that HP1α and PADI4 are regulators of both immune genes and HERVs, and that multiple events of transcriptional reactivation in MS patients can be explained by the deficiency of a single mechanism of gene silencing.


Conflict of interest statement

The authors have declared that no competing interests exist.

Figures
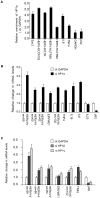
Figure 1
Figure 1. HP1α involved in silencing of HERVs and cytokines.
(A) HP1α is present on the promoter of HERVs and cytokines in MCF7 cells. Chromatin prepared from MCF7 cells were subjected to ChIP using anti-HP1α antibodies. The relative enrichment was measured by qPCR on Satellite 2 sequences, the LTR regions of shown HERVs and on the promoter regions of TNFα, pS2 and GAPDH. Data are normalized to the values obtained with non-immune IgGs and expressed relatively to GAPDH (set to 1). Shown data are means +/− SEM from four experiments. (B and C) Total RNA from MCF7 cells transfected with the indicated small interfering RNAs (siRNAs) was quantified with RT-qPCR. Changes in mRNA levels are shown relative to the siGAPDH transfection (set to 1), which was not affecting the mRNA levels of the genes of interest (Figure. S1B). The data are presented as the means ± SEM of triplicate experiments.
Figure 2
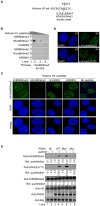
Figure 2. An antibody specific for histone H3cit8K9me3 reveals increased levels of this double modification catalyzed by PADI4.
(A) Epitope used to generate the anti-H3cit8K9me3 antibody. The antibody was raised against a peptide mimicking histone H3 citrullinated at position 8 and tri-methylated on K9. (B) Dot blot highlighting the specificity of the anti-H3cit8K9me3, performed with 1, 0.2, and 0.04 µg of H3 peptides bearing the indicated post-translational modifications. (C) Specificity of the anti-H3cit8K9me3 antibody test by competition with H3 peptides. MCF7 cells were extracted, fixed and incubated with the indicated peptides along with anti-H3cit8K9me3 antibodies and DAPI. Scale bar 5 µm. (D) Similar staining with anti-H3cit8K9me3 and anti-H3cit(2,8,17) antibodies. Indirect immunofluorescent staining of MCF7 cells with DAPI to visualize the DNA and either anti-H3cit8K9me3 (b1–b2) or anti-H3cit(2,8,17) (b3–b4). (E) HEK293 cells that stably integrate a ponasterone A-inducible construct with either no insert (NI) or an insert coding for wild-type (WT), hyperactive (Mut+), or hypoactive (Mut−) PADI4 were cultured without or with ionophore (A23187). Total protein extracts were immunoblotted with the indicated antibodies. Signals were quantified with the Image J software (NI without treatment set to 1).
Figure 3
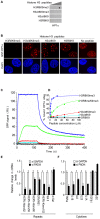
Figure 3. The H3cit8K9me3 double histone modification reduces the affinity of HP1α for the H3K9me3 single modification.
(A) Dot blot showing that HP1α does not bind to histone H3 peptides carrying a H3Cit8K9me3 double modification. Indicated histone H3 peptides of 1, 0.2, and 0.04 µg were spotted on the membranes. Then binding of recombinant GST-HP1α was tested by labeling of the retained protein with anti-GST antibodies. Blots are representative of the experimental replicates. (B) Purified recombinant GST-HP1α (red) was bound to fixed MCF7 cells in “overlay” assays, and then challenged by competition with 1 µg of the indicated peptides. DNA is labeled with DAPI (blue), scale bar: 5 µm. (C) Real-time association and dissociation surface plasmon resonance (SPR) profiles corresponding to the injection of the indicated H3 peptides at 12.5 µM over immobilized GST-HP1α. (D) Percentage of bound GST-HP1α sites as a function of the peptide concentration. (E–F) Total RNA from MCF7 cells transfected with the PADI4 small interfering RNAs (siRNAs) was quantified with RT-qPCR. Changes in mRNA levels are shown relative to the siGAPDH transfection (set to 1), which was not affecting the mRNA levels of the genes of interest (Figure S1C). The data are presented as the means ± SEM of triplicate experiments.
Figure 4
Figure 4. PADI4 activity controls HP1α occupancy and histone H3 citrullination at TNFα and HERV promoters.
(A) Total protein extracts from MCF7 cells treated either estradiol (E2) or ionophore (A23187) and/or Cl-amidine were immunoblotted with the indicated antibodies. (B) Total RNA from MCF7 cells either untreated or treated with estradiol followed by ionophore (E2+A23187) and/or Cl-amidine (E2+A23187+Cl-amidine) treatment was quantified by RT-qPCR. Data are shown relative to the un-induced condition (set to 1). Values are mean ± SEM from four experimental replicates. (C–E) ChIP with the listed antibodies was carried out with chromatin from MCF7 cells either untreated or treated with estradiol and ionophore (E2+A23187) in the absence or presence of Cl-amidine. The relative enrichments of the indicated antibodies on the shown LTRs or promoters were measured by qPCR. Data are presented as a percentage of histone H3 or relative to non-immune IgG as indicated. Enrichments are presented relative to indicated controls (set to 1). Values are means ± SEM from four PCR measures of representative ChIP experiments.
Figure 5
Figure 5. PADI activity facilitates activation of TNFα and IL8 transcription in T cells.
(A) ChIP with anti-HP1α antibodies was carried out with chromatin from Jurkat cells either untreated or treated with PMA and ionophore (ionomycin). The relative enrichments of HP1α on the indicated promoters were measured by qPCR. Data are presented relative to non-immune IgG. Changes in enrichment are presented relative to the un-induced control (set to 1). Values are means ± SEM from two PCR measures of two independent ChIP experiments. (B) Total RNA was isolated from Jurkat cells either un-stimulated or treated with ionomycin and PMA for 2 hour. Changes in mRNA levels for the indicated genes were quantified by RT-qPCR. The data are presented as the means ± SEM of triplicate experiments. (C) ChIP with anti-H3cit8K9me3 antibodies was carried out as in A. Data are presented as a percentage of histone H3. Changes in enrichment are presented relative to the un-induced control (set to 1). Values are means ± SEM from two PCR measures of two independent ChIP experiments. (D) Total RNA was isolated from Jurkat cells treated as in B minus or plus PADI-inhibitor cl-amidine as indicated. Changes in mRNA levels for the indicated genes were quantified by RT-qPCR. The data are presented as the means ± SEM of duplicate experiments.
Figure 6
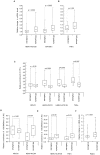
Figure 6. Modified accumulation of HP1α and H3cit8K9me3 at HERVs and TNFα in MS patients.
(A–B) Expression of HERVs and TNFα in PBMCs from 18 families (n = 36 individuals) each consisting of one MS patient and a genetically related unaffected relative. Total RNA was prepared from the PBMCs and indicated transcripts were quantified by RT-qPCR. Values are means ±SE from at least 3 qPCR reactions for each individual. For each family, the basal level used to calculate the fold-change was the average of at least 3 qPCR values obtained from the healthy control. (C) ChIP with anti-HP1α on chromatin extracted at same time from PBMCs from above mentioned 18 families. The relative enrichment of HP1α on the LTR or promoter region of HERVs and TNFα was measured by qPCR and normalized to the signal obtained with irrelevant non-immune IgGs. The reported values are means ± SEM from at least three qPCRs for each individual (n = 36) from a representative ChIP experiment (* p<0.05, significant and °p>0.05 not significant, Wilcoxon signed rank test). (D–E) ChIP with anti-H3cit8K9me3 on chromatin extracted from PBMCs from 9 families. The relative enrichment of H3cit8K9me3 on the LTR or promoter region was measured by qPCR and data are presented as a percentage of histone H3. The reported values are means ± SEM from at least three qPCRs for each individual (n = 18) from a representative ChIP experiment. The enrichment of H3cit8K9me3 on the HERV/LTR59 is also higher in MS patients as compared to healthy individuals, but due to the small sample size, the p value (*° p = 0.06) is not significant and could not be interpreted (* p<0.05, significant and °p>0.05, not significant, Wilcoxon signed rank test). (F) PADI4 mRNA levels were quantified by RT-qPCR in total RNA prepared from PBMCs of 18 families each including one MS patients and one genetically related control individual. Values are means +/−SE from at least 3 qPCR reactions for each individual. The p value (p<0.0007) was calculated by Wilcoxon signed rank test. In each panel, the boxes represent the interquartile range. The whiskers extend the box to the highest and lowest value. The line across the box indicates the median value.
Figure 7
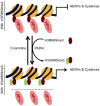
Figure 7. Model.
HP1α silences HERVs and represses several cytokines until they are stimulated. It binds the tri-methylated lysine 9 of histone H3 on these promoters.This binding is in part regulated by PADI4 conversion of histone H3 arginine 8 into a citrulline, thereby reducing the affinity of HP1α for the neighboring methylated lysine 9. In MS patients, PADI4 induces an enrichment of H3cit8K9me3 double histone modification resulting in reduced accumulation of HP1α on HERVs, on the promoter of TNFα and possibly on other cytokines genes. This in turn may be responsible for excessive expression of HERVs and cytokines that inappropriately activate T lymphocytes and ultimately damages the central nervous system. It may be possible to interrupt this sequence of event with the PADI4 specific inhibitor Cl-amidine.

Similar articles

Cited by

References

    1. Noseworthy JH, Lucchinetti C, Rodriguez M, Weinshenker BG (2000) Multiple sclerosis. N Engl J Med 343: 938–952. - PubMed
    1. O'Brien K, Gran B, Rostami A (2010) T-cell based immunotherapy in experimental autoimmune encephalomyelitis and multiple sclerosis. Immunotherapy 2: 99–115. - PMC - PubMed
    1. Chitnis T (2007) The role of CD4 T cells in the pathogenesis of multiple sclerosis. International review of neurobiology 79: 43–72. - PMC - PubMed
    1. Imitola J, Chitnis T, Khoury SJ (2005) Cytokines in multiple sclerosis: from bench to bedside. Pharmacol Ther 106: 163–177. - PubMed
    1. Brudek T, Christensen T, Aagaard L, Petersen T, Hansen HJ, et al. (2009) B cells and monocytes from patients with active multiple sclerosis exhibit increased surface expression of both HERV-H Env and HERV-W Env, accompanied by increased seroreactivity. Retrovirology 6: 104. - PMC - PubMed

Publication types

MeSH terms

Grants and funding

This work was supported in part by the Agence National pour la Recherche, by the Fondation pour la Recherche Medicale, and by the ARSEP foundation. PS received support from the Sandwich Fellowship Program of the French Embassy in India and from the Institut National de la Santé et de la Recherche Médicale. TC, AM-L, and TP were supported by the Aase and Ejnar Danielsen Foundation and the Danish MS Society. The funders had no role in study design, data collection and analysis, decision to publish, or preparation of the manuscript.