

Maintenance of peripheral T cell responses during Mycobacterium tuberculosis infection
- PMID: 23028057
- PMCID: PMC3819137
- DOI: 10.4049/jimmunol.1201153
Maintenance of peripheral T cell responses during Mycobacterium tuberculosis infection
Abstract
Fully functional T cells are necessary for the maintenance of protective immunity during chronic infections. However, activated T cells often undergo apoptosis or exhaustion upon chronic stimulation mediated by Ag or inflammation. T cell attrition can be compensated for by the production of thymus-derived T cells, although the new naive T cells must undergo T cell priming and differentiation under conditions different from those encountered during acute infection. We used a murine model of Mycobacterium tuberculosis infection to address how the activation and differentiation of new thymic emigrants is affected by chronic inflammation, as well as whether the newly developed effector T cells help to maintain peripheral T cell responses. Although new thymic emigrants contributed to the peripheral T cell response early during acute M. tuberculosis infection, the relative contribution of new effector T cells to the peripheral CD4 and CD8 T cell pools declined during chronic infection. The decline in new T cell recruitment was a consequence of quantitative and/or qualitative changes in Ag presentation, because during chronic infection both the priming and expansion of naive T cells were inefficient. Thus, although thymic tolerance is not a major factor that limits protective T cell responses, the chronic environment does not efficiently support naive T cell priming and accumulation during M. tuberculosis infection. These studies support our previous findings that long-term protective T cell responses can be maintained indefinitely in the periphery, but also suggest that the perturbation of homeostasis during chronic inflammatory responses may elicit immune pathology mediated by new T cells.
Figures
Similar articles
-
T cells home to the thymus and control infection.J Immunol. 2013 Feb 15;190(4):1646-58. doi: 10.4049/jimmunol.1202412. Epub 2013 Jan 11. J Immunol. 2013. PMID: 23315077 Free PMC article.
-
Selectin ligand-independent priming and maintenance of T cell immunity during airborne tuberculosis.J Immunol. 2006 Jan 15;176(2):1131-40. doi: 10.4049/jimmunol.176.2.1131. J Immunol. 2006. PMID: 16394002
-
Efficient 5-OP-RU-Induced Enrichment of Mucosa-Associated Invariant T Cells in the Murine Lung Does Not Enhance Control of Aerosol Mycobacterium tuberculosis Infection.Infect Immun. 2020 Dec 15;89(1):e00524-20. doi: 10.1128/IAI.00524-20. Print 2020 Dec 15. Infect Immun. 2020. PMID: 33077620 Free PMC article.
-
Thymic commitment of regulatory T cells is a pathway of TCR-dependent selection that isolates repertoires undergoing positive or negative selection.Curr Top Microbiol Immunol. 2005;293:43-71. doi: 10.1007/3-540-27702-1_3. Curr Top Microbiol Immunol. 2005. PMID: 15981475 Review.
-
T cells in mycobacterial infection and disease.Curr Opin Immunol. 2009 Aug;21(4):378-84. doi: 10.1016/j.coi.2009.06.004. Epub 2009 Jul 29. Curr Opin Immunol. 2009. PMID: 19646851 Free PMC article. Review.
Cited by
-
Immunological hyporesponsiveness in tuberculosis: The role of mycobacterial glycolipids.Front Immunol. 2022 Dec 2;13:1035122. doi: 10.3389/fimmu.2022.1035122. eCollection 2022. Front Immunol. 2022. PMID: 36544778 Free PMC article. Review.
-
IL12B expression is sustained by a heterogenous population of myeloid lineages during tuberculosis.Tuberculosis (Edinb). 2013 May;93(3):343-56. doi: 10.1016/j.tube.2013.02.011. Epub 2013 Mar 13. Tuberculosis (Edinb). 2013. PMID: 23491716 Free PMC article.
-
Thymus, undernutrition, and infection: Approaching cellular and molecular interactions.Front Nutr. 2022 Sep 26;9:948488. doi: 10.3389/fnut.2022.948488. eCollection 2022. Front Nutr. 2022. PMID: 36225882 Free PMC article. Review.
-
Future Path Toward TB Vaccine Development: Boosting BCG or Re-educating by a New Subunit Vaccine.Front Immunol. 2018 Oct 16;9:2371. doi: 10.3389/fimmu.2018.02371. eCollection 2018. Front Immunol. 2018. PMID: 30386336 Free PMC article.
-
Dynamics of thymus function and T cell receptor repertoire breadth in health and disease.Semin Immunopathol. 2021 Feb;43(1):119-134. doi: 10.1007/s00281-021-00840-5. Epub 2021 Feb 19. Semin Immunopathol. 2021. PMID: 33608819 Free PMC article. Review.
References
-
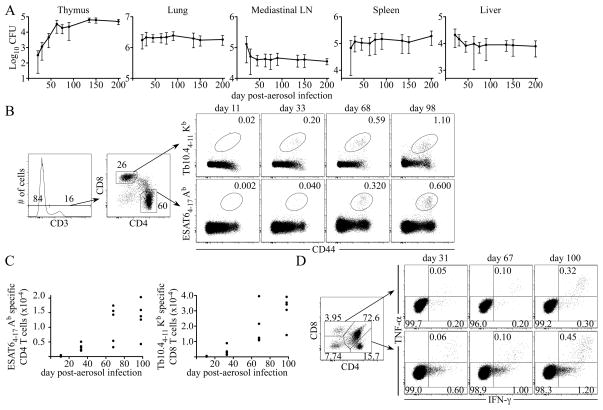
- Reiley WW, Calayag MD, Wittmer ST, Huntington JL, Pearl JE, Fountain JJ, Martino CA, Roberts AD, Cooper AM, Winslow GM, Woodland DL. ESAT-6-specific CD4 T cell responses to aerosol Mycobacterium tuberculosis infection are initiated in the mediastinal lymph nodes. Proc Natl Acad Sci USA. 2008;105:10961–10966. - PMC - PubMed
-
- North RJ, Jung YJ. Immunity to tuberculosis. Annu Rev Immunol. 2004;22:599–623. - PubMed
Publication types
MeSH terms
Grants and funding
LinkOut - more resources
Full Text Sources
Research Materials