. 2012 Nov;19(11):1193-201.
doi: 10.1038/nsmb.2392. Epub 2012 Sep 30.

Convergent transcription induces transcriptional gene silencing in fission yeast and mammalian cells

Affiliations

Convergent transcription induces transcriptional gene silencing in fission yeast and mammalian cells

Monika Gullerova et al. Nat Struct Mol Biol. 2012 Nov.

Abstract

We show that convergent transcription induces transcriptional gene silencing (TGS) in trans for both fission yeast and mammalian cells. This method has advantages over existing strategies to induce gene silencing. Previous studies in fission yeast have characterized TGS as a cis-specific process involving RNA interference that maintains heterochromatic regions such as centromeres. In contrast, in mammalian cells, gene silencing is known to occur through a post-transcriptional mechanism that uses exogenous short interfering RNAs or endogenous microRNAs to inactivate mRNA. We now show that the introduction of convergent transcription plasmids into either Schizosaccharomyces pombe or mammalian cells allows the production of double-stranded RNA from inserted gene fragments, resulting in TGS of endogenous genes. We predict that using convergent transcription to induce gene silencing will be a generally useful strategy and allow for a fuller molecular understanding of the biology of TGS.


Figures
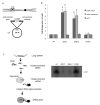
Figure 1
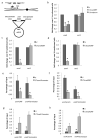
Figure 1. S. pombe transformed CT plasmids are silenced by RNAi
(a) Diagram depicting CT plasmid containing ura4 ORF transcribed by bidirectional nmt1 promoters in a ura-S. pombe strain. MCS denotes multiple cloning site. Positions of convergent nmt1 promoters are shown by arrows. (b) qRT-PCR. Levels of ura4 sense and antisense transcript measured by strand specific qRT-PCR for different CTura4ORF transformed S. pombe RNAi mutant strains. All bars represent average values ± SD from at least three independent biological experiments. * indicates statistical significance (p < 0.05), based on unpaired, two-tailed distribution Student’s t-test. (c) p19 siRNA pull down. Diagram showing use of p19 protein beads to select siRNAs hybridized to ura4 probes (5′end 32P labelled DNA oligonucleotides). Gel image of ura4 probes selectively isolated are shown
Figure 2
Figure 2. CT ura4 plasmids induce TGS of endogenous ura4 in S. pombe
(a) CT ura4 plasmid diagram showing endogenous ura4 with indicated positions of ChIP probes on endogenous ura4 as indicated. (b) qRT-PCR. CT ura4 plasmids containing either ura4 ORF or promoter sequences induce selective reduction of endogenous ura4 but not act1 mRNA levels as measured by qRT-PCR using oligodT primer for cDNA synthesis. Empty CT vector (V) was used as normalizing control. Induction period of CT nmt1 promoters by growth in EMM was overnight (as for all experiments except for (c,d)). (c,d) qRT-PCR of nascent ura4 RNA (using RT primer across PAS) or ura4 mRNA (using oligodT RT primer) following induction of CT for three days. (e,f) ChIP analysis using Pol II specific antibody on chromatin isolated for CTura4prom or CTura4ORF transformed S. pombe with PCR primer pairs as indicated in (a). (g,h) ChIP analysis using histone H3K9me3 specific antibody as in (e,f) All RT-PCR and ChIP values are based on average values ± SD from at least three independent biological experiments. * indicates statistical significance (p < 0.05), based on unpaired, two-tailed distribution Student’s t-test.
Figure 3
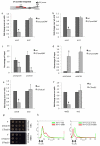
Figure 3. Integrated CT constructs promote endogenous ura4 TGS in trans
(a,b) qRT-PCR. iCTura4ORF transformed S. pombe shows reduced levels of endogenous ura4 nascent RNA(a) and mRNA(b) based on qRT-PCR analysis. Diagram shows integrated CT chromosome with position of RT primer used to detect nascent RNA (not cleaved at PAS). Also shown, nmt1 promoters (red arrows) and endogenous ura4. (c,d) ChIP analysis. Endogenous ura4 is subjected to trans TGS from iCTura4ORF as judged by Pol II and H3K9me3 ChIP analysis. (e,f) qRT-PCR. Induction of iCTcdc10 and iCTrad21 integrated into S. pombe causes a selective reduction in endogenous cdc10 and rad21 mRNA levels based on qRT-PCR analysis. All RT-PCR and ChIP values in a-f) are based on average values ± SD from at least three independent biological experiments. * indicates statistical significance (p < 0.05), based on unpaired, two-tailed distribution Student’s t-test. (g) Growth analysis. iCTcdc10 and iCTrad21 integrated S. pombe strains show a growth defect following CT induction on EMM plates. (h) FACs analysis showing that iCTcdc10 S. pombe are synchronized in G1 cell cycle phase following EMM growth. Unsynchronised wt cells display a G2 FACs profile as this is the longest cell cycle phase.
Figure 4
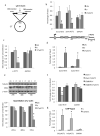
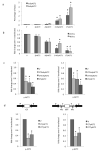
Figure 4. Transfection of mammalian CTura4 plasmid induces γ-ACT1 TGS
(a) Diagram of CT γACT1 containing γACT1 cDNA (exons 2-6). (b) Pol II ChIP analysis of γ-ACT1 or GAPDH control using amplicons specific to endogenous gene as shown on gene diagram below. Chromatin was isolated from HeLa cells transiently transfected with CT vector alone (V), CTγACT1 or untransfected (UN). (c) qRT-PCR. Measurement of mRNA levels using oligodT primed qRT-PCR on RNA from HeLa cells transfected as in (b). (d) H3K9me3 antibody ChIP as in (b). (e) Western blot analysis and quantitation of γ-actin protein levels compared to tubulin and OAS1 on total protein isolated from HeLa cells transfected as in (b) for 1-3 days. (f) qRT-PCR. Effect of CTγACT1 transfection of ES cells, wt or ΔDCR1 on nascent transcript levels from γ-ACT1 versus GAPDH. (g) Ago2 ChIP on chromatin from V or CTγACT1 transfected HeLa cells using specific amplicons for endogenous γ-ACT1 or GAPDH. All RT-PCR and ChIP values in b, c, d, f and g are based on average values ± SD from at least three independent biological experiments. * indicates statistical significance (p < 0.05), based on unpaired, two-tailed distribution Student’s t-test.
Figure 5
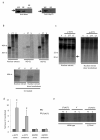
Figure 5. in vitro and in vivo analysis of nuclear dicer activity
(a) Western blot analysis of dicer and Hsp-70 from whole cell extract (WE) versus nuclear extract (NE) with or without dicer immunodepletion (NE-dicer). Hsp70 was only detectable in WE confirming purity of NE. (b) In vitro transcription. NE dependent in vitro transcription of CTγACT1 Ex4 (390 nt RNA) and vector alone plus control run off template (yielding 363 nt RNA). Following the transcription reaction, RNA was isolated and fractionated. The long RNA fraction was treated with S1 (single strand specific), V1 (double strand specific) nucleases. Lower panel shows that dicer depleted NE still yields CT derived dsRNA. (c) In vitro transcription. Fractionation of small RNAs isolated from templates as indicated (Supplementary Fig. 4). S denotes single promoter construct making just a sense transcript. Only CT and CTT yield detectible siRNAs (denoted by arrow) but not in dicer depleted NE. (d) qRT-PCR. Immunoselection of dsRNA from CTγACT1 or V transfected Hela cells using J2 antibody. Sense and antisense transcripts from CTγACT1 or endogenous GAPDH were monitored by qRT/PCR using strand specific RT primers. RT-PCR values in are based on average values ± SD from at least three independent biological experiments. * indicates statistical significance (p < 0.05), based on unpaired, two-tailed distribution Student’s t-test. (e) p19 selection of siRNAs using 32P γ-ACT1 DNA oligonucletides (as in Fig. 1c). HEK293 (inducible dicer knockdown cells) were transfected with CTγACT1 or V. See online Methods for details.
Figure 6
Figure 6. Specificity of TGS induction by CTγACT1 transfection
(a,b) ChIP and qRT-PCR. H3K9me3 ChIP and γ-actin mRNA qRT-PCR respectively were performed as in Fig. 4 but using additional γ-ACT1 (Ex2-6) expression constructs: sense (S) or antisense (AS) alone γ-ACT1 transcription plasmids or S and AS plasmids cotransfected. Note only CT plasmid is effective in inducing full levels of heterochromatin and maximum reduction in mRNA levels. (c) qRT-PCR. CT constructs containing γ-ACT1 intron 3 or exon 4 only were compared for TGS effects versus the full CT γACT1Ex2-6 sequence measuring polyA+ mRNA (left) and nascent (right) (intronic) transcript. (d) qRT-PCR. CT γACT1 (Ex2-6) plasmid was modified by positioning PAS derived from SV40 at either end of the γ-ACT1 sequence so that both S and AS transcripts are polyadenylated (Supplementary Fig. 4). The TGS effects were then determined for both nascent (left) and steady state (right) γ-ACT1 transcripts by qRT/PCR analysis. P denotes CMV promoter and T, SV40 PAS. All RT-PCR and ChIP values are based on average values ± SD from at least three independent biological experiments. * indicates statistical significance (p < 0.05), based on unpaired, two-tailed distribution Student’s t-test.
Figure 7
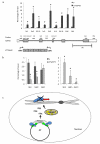
Figure 7. Spatial and temporal properties of plasmid induced TGS
(a) ChIP analysis. The extent of CTTDP43 induced gene silencing across TDP-43 was measured by H3K9me3 ChIP analysis. Heterochromatin spreading was largely restricted to regions directly targeted by the CT construct. TDP-43 gene map is shown below with exons as boxes and introns as lines. Positions of PCR amplicons used are indicated (b) ChIP analysis. TGS effects (Pol II and H3K9me3 ChIP) were measured over longer time points post transfection of CTγACT1. All ChIP signals in a) and b) are based on average values ± SD from at least three independent biological experiments. * indicates statistical significance (p < 0.05), based on unpaired, two-tailed distribution Student’s t-test. (c) Model depicting the mechanism of nuclear TGS in mammals. Chromosome and plasmid transcription are indicated. Active Pol II (in blue) transcription is depicted by green arrows and inactive transcription by red arrows. Nuclear RNAi apparatus (in yellow) dsRNA and siRNA are also indicated.

Similar articles

Cited by

References

    1. Grewal SI. RNAi-dependent formation of heterochromatin and its diverse functions. Curr Opin Genet Dev. 2010;20:134–141. - PMC - PubMed
    1. Baulcombe D. RNA silencing in plants. Nature. 2004;431:356–363. - PubMed
    1. Bartel DP. MicroRNAs: target recognition and regulatory functions. Cell. 2009;136:215–233. - PMC - PubMed
    1. Verdel A, Vavasseur A, Le Gorrec M, Touat-Todeschini L. Common themes in siRNA-mediated epigenetic silencing pathways. Int J Dev Biol. 2009;53:245–257. - PubMed
    1. Carthew RW, Sontheimer EJ. Origins and Mechanisms of miRNAs and siRNAs. Cell. 2009;136:642–655. - PMC - PubMed

Publication types

MeSH terms

Substances