TRPV4 is a regulator of adipose oxidative metabolism, inflammation, and energy homeostasis
- PMID: 23021218
- PMCID: PMC3477522
- DOI: 10.1016/j.cell.2012.08.034
TRPV4 is a regulator of adipose oxidative metabolism, inflammation, and energy homeostasis
Abstract
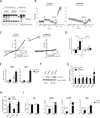
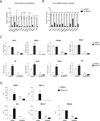
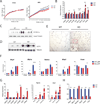
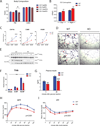
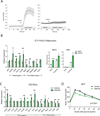
PGC1α is a key transcriptional coregulator of oxidative metabolism and thermogenesis. Through a high-throughput chemical screen, we found that molecules antagonizing the TRPVs (transient receptor potential vanilloid), a family of ion channels, induced PGC1α expression in adipocytes. In particular, TRPV4 negatively regulated the expression of PGC1α, UCP1, and cellular respiration. Additionally, it potently controlled the expression of multiple proinflammatory genes involved in the development of insulin resistance. Mice with a null mutation for TRPV4 or wild-type mice treated with a TRPV4 antagonist showed elevated thermogenesis in adipose tissues and were protected from diet-induced obesity, adipose inflammation, and insulin resistance. This role of TRPV4 as a cell-autonomous mediator for both the thermogenic and proinflammatory programs in adipocytes could offer a target for treating obesity and related metabolic diseases.
Copyright © 2012 Elsevier Inc. All rights reserved.
Figures


Comment in
-
Metabolic disorders: Browning fat.Nat Rev Drug Discov. 2012 Dec;11(12):907. doi: 10.1038/nrd3896. Nat Rev Drug Discov. 2012. PMID: 23197032 No abstract available.
Similar articles
-
Two key temporally distinguishable molecular and cellular components of white adipose tissue browning during cold acclimation.J Physiol. 2015 Aug 1;593(15):3267-80. doi: 10.1113/JP270805. Epub 2015 Jul 14. J Physiol. 2015. PMID: 26096127 Free PMC article.
-
Differentiation and characterization in primary culture of white adipose tissue brown adipocyte-like cells.Int J Obes (Lond). 2009 Jun;33(6):680-6. doi: 10.1038/ijo.2009.46. Epub 2009 Mar 10. Int J Obes (Lond). 2009. PMID: 19274054
-
Effect of quercetin on nonshivering thermogenesis of brown adipose tissue in high-fat diet-induced obese mice.J Nutr Biochem. 2021 Feb;88:108532. doi: 10.1016/j.jnutbio.2020.108532. Epub 2020 Oct 29. J Nutr Biochem. 2021. PMID: 33130188
-
UCP1: its involvement and utility in obesity.Int J Obes (Lond). 2008 Dec;32 Suppl 7(Suppl 7):S32-8. doi: 10.1038/ijo.2008.236. Int J Obes (Lond). 2008. PMID: 19136989 Free PMC article. Review.
-
Transcriptional regulation of the uncoupling protein-1 gene.Biochimie. 2017 Mar;134:86-92. doi: 10.1016/j.biochi.2016.09.017. Epub 2016 Oct 5. Biochimie. 2017. PMID: 27693079 Review.
Cited by
-
NCLX prevents cell death during adrenergic activation of the brown adipose tissue.Nat Commun. 2020 Jul 3;11(1):3347. doi: 10.1038/s41467-020-16572-3. Nat Commun. 2020. PMID: 32620768 Free PMC article.
-
DDX3X Suppresses the Susceptibility of Hindbrain Lineages to Medulloblastoma.Dev Cell. 2020 Aug 24;54(4):455-470.e5. doi: 10.1016/j.devcel.2020.05.027. Epub 2020 Jun 17. Dev Cell. 2020. PMID: 32553121 Free PMC article.
-
A network perspective on unraveling the role of TRP channels in biology and disease.Pflugers Arch. 2014 Feb;466(2):173-82. doi: 10.1007/s00424-013-1292-2. Epub 2013 May 16. Pflugers Arch. 2014. PMID: 23677537 Review.
-
Irs2 deficiency alters hippocampus-associated behaviors during young adulthood.Biochem Biophys Res Commun. 2021 Jun 25;559:148-154. doi: 10.1016/j.bbrc.2021.04.101. Epub 2021 Apr 30. Biochem Biophys Res Commun. 2021. PMID: 33940386 Free PMC article.
-
Adaptive thermogenesis in adipocytes: is beige the new brown?Genes Dev. 2013 Feb 1;27(3):234-50. doi: 10.1101/gad.211649.112. Genes Dev. 2013. PMID: 23388824 Free PMC article. Review.
References
-
- Barbatelli G, Murano I, Madsen L, Hao Q, Jimenez M, Kristiansen K, Giacobino JP, De Matteis R, Cinti S. The emergence of cold-induced brown adipocytes in mouse white fat depots is determined predominantly by white to brown adipocyte transdifferentiation. Am J Physiol Endocrinol Metab. 2010;298:E1244–E1253. - PubMed
-
- Cao W, Medvedev AV, Daniel KW, Collins S. beta-Adrenergic activation of p38 MAP kinase in adipocytes: cAMP induction of the uncoupling protein 1 (UCP1) gene requires p38 MAP kinase. J Biol Chem. 2001;276:27077–27082. - PubMed
-
- Cederberg A, Gronning LM, Ahren B, Tasken K, Carlsson P, Enerback S. FOXC2 is a winged helix gene that counteracts obesity, hypertriglyceridemia, and diet-induced insulin resistance. Cell. 2001;106:563–573. - PubMed
Publication types
MeSH terms
Substances
Associated data
- Actions
Grants and funding
LinkOut - more resources
Full Text Sources
Other Literature Sources
Molecular Biology Databases

