

Sequence-dependent sliding kinetics of p53
- PMID: 23012405
- PMCID: PMC3478643
- DOI: 10.1073/pnas.1120452109
Sequence-dependent sliding kinetics of p53
Abstract
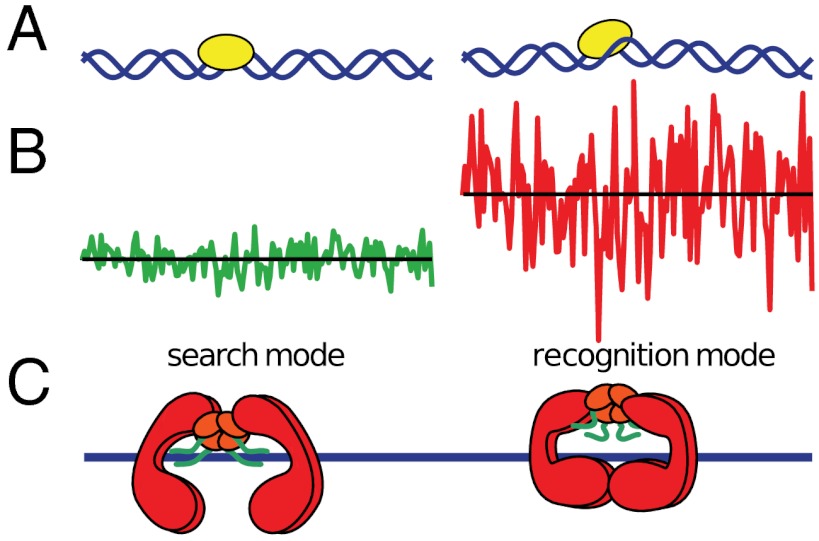
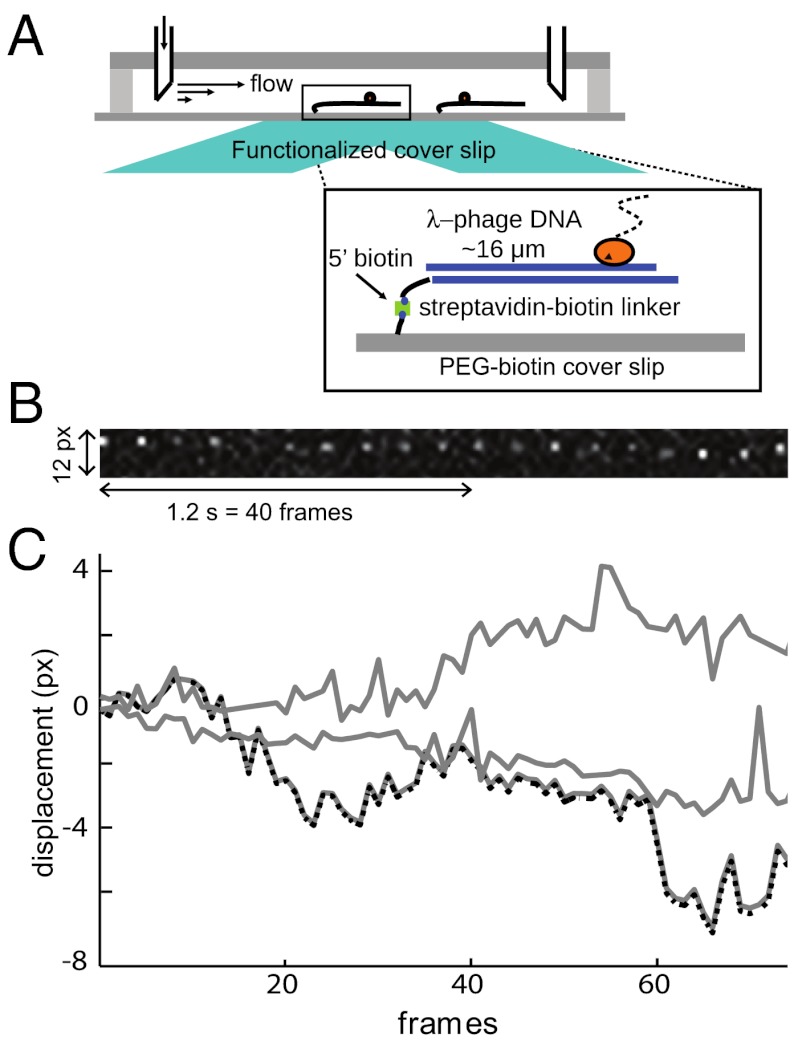
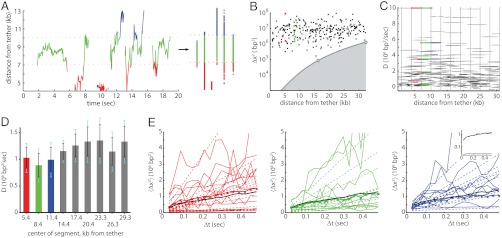
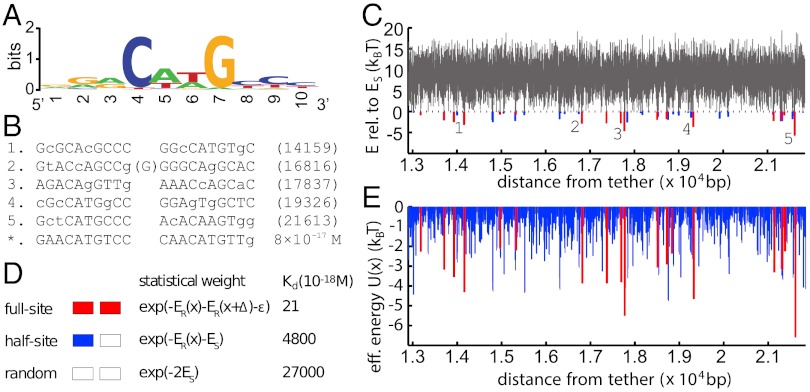
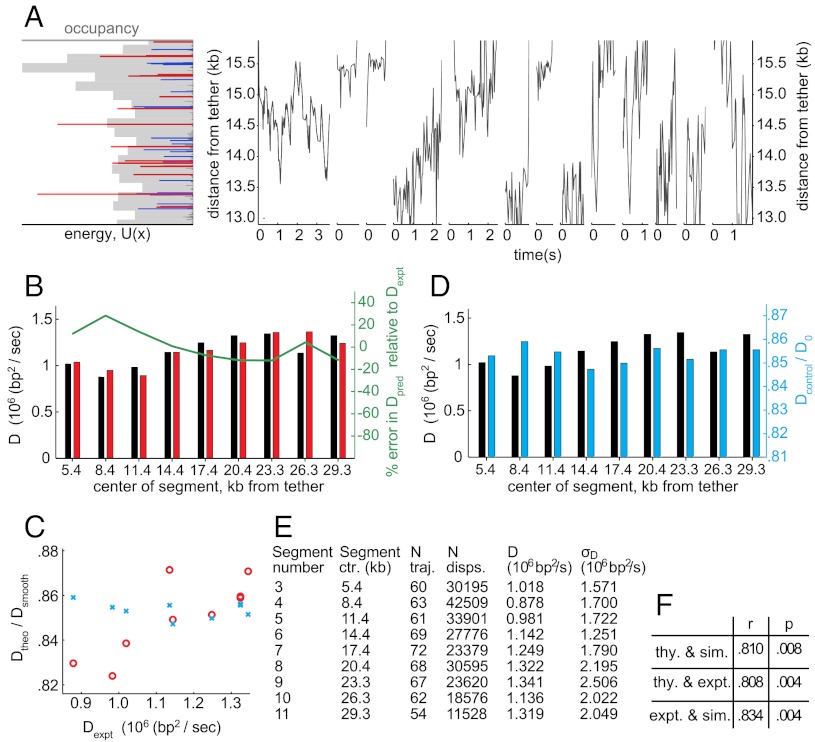
Proper timing of gene expression requires that transcription factors (TFs) efficiently locate and bind their target sites within a genome. Theoretical studies have long proposed that one-dimensional sliding along DNA while simultaneously reading its sequence can accelerate TF's location of target sites. Sliding by prokaryotic and eukaryotic TFs were subsequently observed. More recent theoretical investigations have argued that simultaneous reading and sliding is not possible for TFs without their possessing at least two DNA-binding modes. The tumor suppressor p53 has been shown to slide on DNA, and recent experiments have offered structural and single molecule support for a two-mode model for the protein. If the model is applicable to p53, then the requirement that TFs be able to read while sliding implies that noncognate sites will affect p53's mobility on DNA, which will thus be generally sequence-dependent. Here, we confirm this prediction with single-molecule microscopy measurements of p53's local diffusivity on noncognate DNA. We show how a two-mode model accurately predicts the variation in local diffusivity, while a single-mode model does not. We further determine that the best model of sequence-specific binding energy includes terms for "hemi-specific" binding, with one dimer of tetrameric p53 binding specifically to a half-site and the other binding nonspecifically to noncognate DNA. Our work provides evidence that the recognition by p53 of its targets and the timing thereof can depend on its noncognate binding properties and its ability to change between multiple modes of binding, in addition to the much better-studied effects of cognate-site binding.
Conflict of interest statement
The authors declare no conflict of interest.
Figures
Similar articles
-
One-Dimensional Sliding of p53 Along DNA Is Accelerated in the Presence of Ca(2+) or Mg(2+) at Millimolar Concentrations.J Mol Biol. 2015 Aug 14;427(16):2663-78. doi: 10.1016/j.jmb.2015.06.016. Epub 2015 Jul 2. J Mol Biol. 2015. PMID: 26143716
-
p53 searches on DNA by rotation-uncoupled sliding at C-terminal tails and restricted hopping of core domains.J Am Chem Soc. 2012 Sep 5;134(35):14555-62. doi: 10.1021/ja305369u. Epub 2012 Aug 22. J Am Chem Soc. 2012. PMID: 22880817
-
DNA-dependent formation of transcription factor pairs alters their binding specificity.Nature. 2015 Nov 19;527(7578):384-8. doi: 10.1038/nature15518. Epub 2015 Nov 9. Nature. 2015. PMID: 26550823
-
Sliding into home: facilitated p53 search for targets by the basic DNA binding domain.Cell Death Differ. 2006 Jun;13(6):881-4. doi: 10.1038/sj.cdd.4401905. Cell Death Differ. 2006. PMID: 16557271 Review. No abstract available.
-
Recognition of Local DNA Structures by p53 Protein.Int J Mol Sci. 2017 Feb 10;18(2):375. doi: 10.3390/ijms18020375. Int J Mol Sci. 2017. PMID: 28208646 Free PMC article. Review.
Cited by
-
Modeling spatial correlation of DNA deformation: DNA allostery in protein binding.J Phys Chem B. 2013 Oct 24;117(42):13378-87. doi: 10.1021/jp4047243. Epub 2013 Jul 8. J Phys Chem B. 2013. PMID: 23795567 Free PMC article.
-
Intrinsically disordered domain of tumor suppressor p53 facilitates target search by ultrafast transfer between different DNA strands.Nucleic Acids Res. 2018 Aug 21;46(14):7261-7269. doi: 10.1093/nar/gky586. Nucleic Acids Res. 2018. PMID: 29986056 Free PMC article.
-
Twist-open mechanism of DNA damage recognition by the Rad4/XPC nucleotide excision repair complex.Proc Natl Acad Sci U S A. 2016 Apr 19;113(16):E2296-305. doi: 10.1073/pnas.1514666113. Epub 2016 Mar 31. Proc Natl Acad Sci U S A. 2016. PMID: 27035942 Free PMC article.
-
Differential salt-induced dissociation of the p53 protein complexes with circular and linear plasmid DNA substrates suggest involvement of a sliding mechanism.Int J Mol Sci. 2015 Jan 30;16(2):3163-77. doi: 10.3390/ijms16023163. Int J Mol Sci. 2015. PMID: 25647416 Free PMC article.
-
Stopped-flow fluorescence kinetic study of protein sliding and intersegment transfer in the target DNA search process.J Mol Biol. 2014 Jan 9;426(1):230-44. doi: 10.1016/j.jmb.2013.09.019. Epub 2013 Sep 25. J Mol Biol. 2014. PMID: 24076422 Free PMC article.
References
-
- Vogelstein B, Lane D, Levine AJ. Surfing the p53 network. Nature. 2000;408:307–310. - PubMed
-
- Berg OG, Winter RB, von Hippel PH. Diffusion-driven mechanisms of protein translocation on nucleic acids. 1. Models and theory. Biochemistry. 1981;20:6929–6948. - PubMed
-
- von Hippel PH, Berg OG. Facilitated target location in biological systems. J Biol Chem. 1989;264:675–678. - PubMed
-
- Kabata H, et al. Visualization of single molecules of RNA polymerase sliding along DNA. Science. 1993;262:1561–1563. - PubMed
MeSH terms
Substances
LinkOut - more resources
Full Text Sources
Research Materials
Miscellaneous
