. 2012 Sep 17;198(6):999-1010.
doi: 10.1083/jcb.201203098.

A PHD12-Snail2 repressive complex epigenetically mediates neural crest epithelial-to-mesenchymal transition

Affiliations

A PHD12-Snail2 repressive complex epigenetically mediates neural crest epithelial-to-mesenchymal transition

Pablo H Strobl-Mazzulla et al. J Cell Biol. .

Abstract

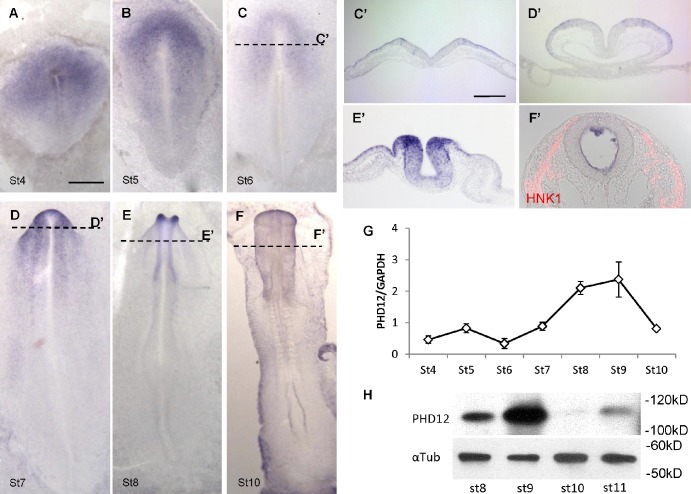
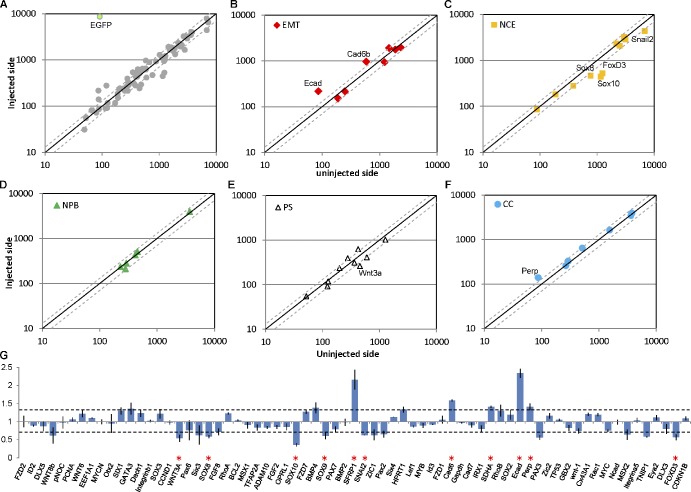
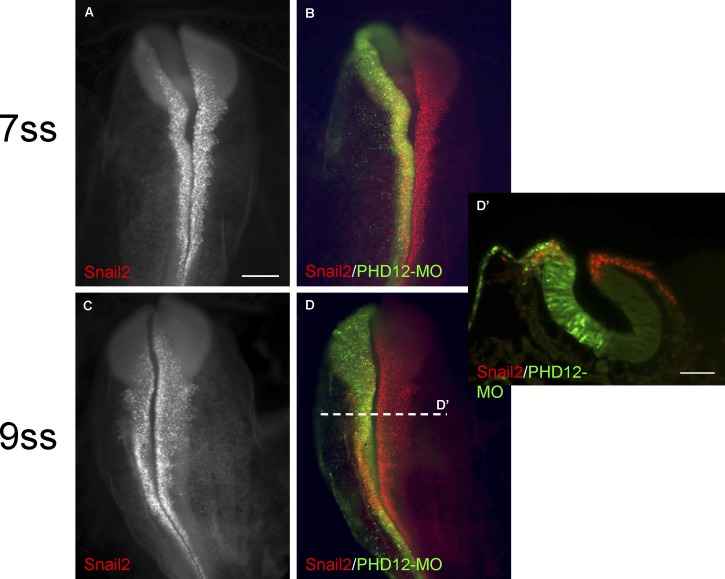
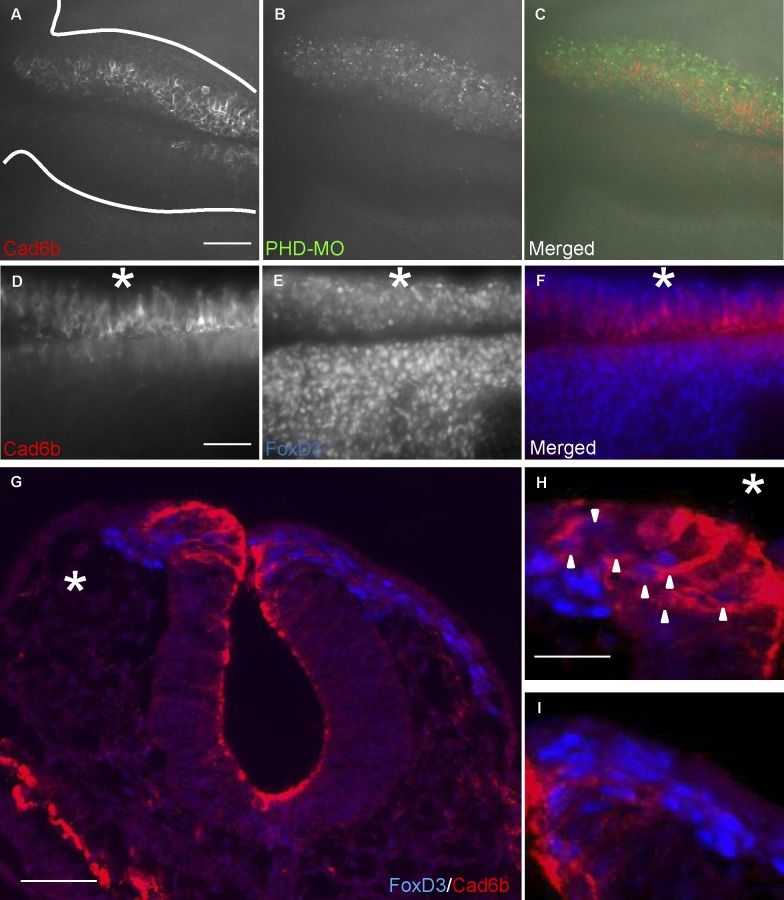
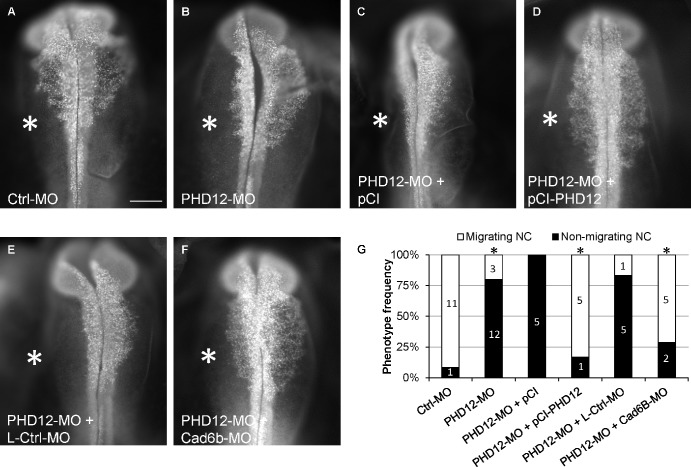
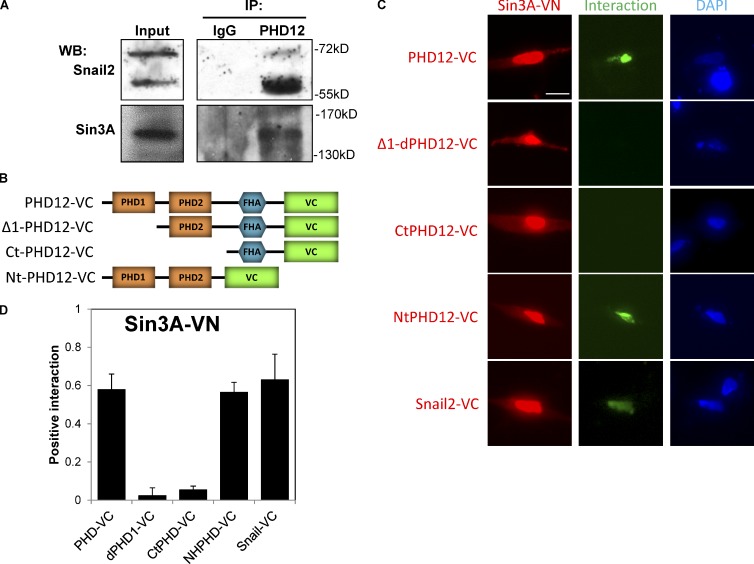
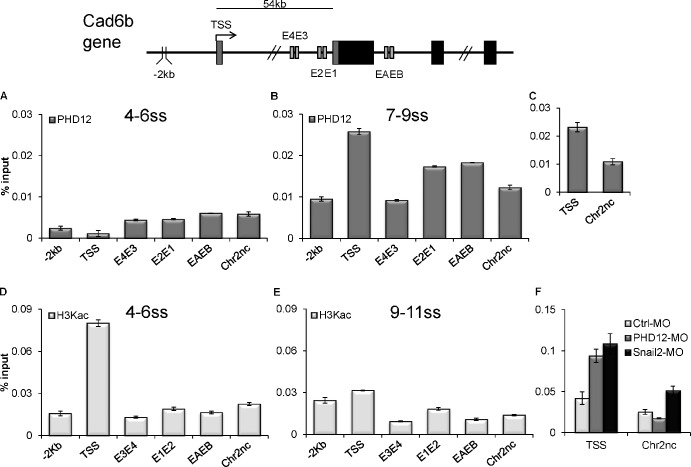
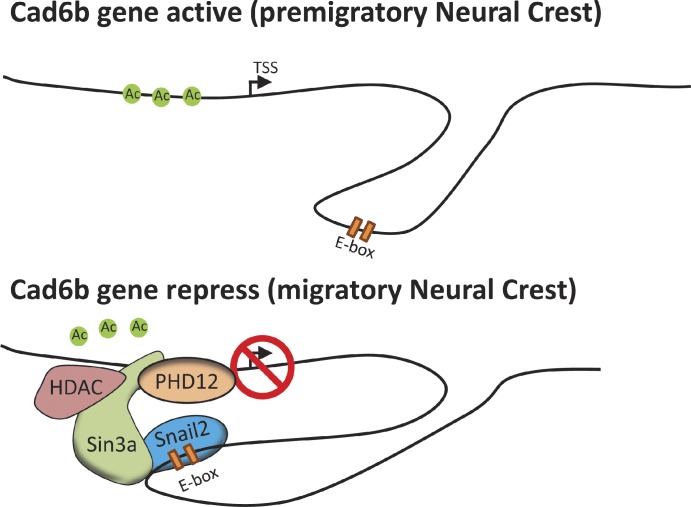
Neural crest cells form within the neural tube and then undergo an epithelial to mesenchymal transition (EMT) to initiate migration to distant locations. The transcriptional repressor Snail2 has been implicated in neural crest EMT via an as of yet unknown mechanism. We report that the adaptor protein PHD12 is highly expressed before neural crest EMT. At cranial levels, loss of PHD12 phenocopies Snail2 knockdown, preventing transcriptional shutdown of the adhesion molecule Cad6b (Cadherin6b), thereby inhibiting neural crest emigration. Although not directly binding to each other, PHD12 and Snail2 both directly interact with Sin3A in vivo, which in turn complexes with histone deacetylase (HDAC). Chromatin immunoprecipitation revealed that PHD12 is recruited to the Cad6b promoter during neural crest EMT. Consistent with this, lysines on histone 3 at the Cad6b promoter are hyperacetylated before neural crest emigration, correlating with active transcription, but deacetylated during EMT, reflecting the repressive state. Knockdown of either PHD12 or Snail2 prevents Cad6b promoter deacetylation. Collectively, the results show that PHD12 interacts directly with Sin3A/HDAC, which in turn interacts with Snail2, forming a complex at the Cad6b promoter and thus revealing the nature of the in vivo Snail repressive complex that regulates neural crest EMT.


Figures

Figure 1.
Figure 1.
PHD12 is expressed at times and locations correlating with neural crest EMT. (A–F′) Expression pattern of PHD12 in the early chick embryo by whole-mount ISH at stages (St) 4–10. Transverse sections (dotted lines) reveal specific expression in the nonneural ectoderm and dorsal neural tube at stages 6–8 (C′–E′) and at low levels in migratory neural crest cells (identified by HNK-1 staining in red) at stage 10 (F′). (G) QPCR analyses show increasing PHD12 expression, peaking at stage 9 and decreasing thereafter at stage 10. Values represent the mean of three samples run in triplicate ± SD. (H) Western blot using PHD12 antibody on five pooled embryos at each stage. αTub, α-tubulin; GAPDH, glyceraldehyde 3-phosphate dehydrogenase. Bars: (A–F) 200 µm; (C′–F′) 100 µm.
Figure 2.
Figure 2.
NanoString analysis reveals that PHD12 loss of function affects Cad6b and neural crest specifier genes. (A) Log scale scatter plot showing changes in expression of 70 genes in the dorsal neural tube on the PHD12-MO–injected versus uninjected side of a single representative embryo fixed at stage 9–10ss. (B–E) The analyzed genes were subdivided into categories corresponding to EMT genes (B); neural crest specifier (NCS) genes (C); neural plate border (NPB) genes (D); and patterning signal (PS) genes (E). Dotted lines represent 30% variation. Of the EMT genes, only E-cadherin (Ecad) and Cad6b were increased >30% on the PHD12-MO–injected side compared with the uninjected side of the same embryo. In contrast, the neural crest specifier genes Sox10, Snail2, FoxD3, and Sox9 were reduced on the morpholino-injected side. CC, cell cycle regulator. (G) Bar graph shows the mean of four embryos representing fold expression differences (means ± SD) between injected and uninjected side on PHD12-MO–treated embryos. Dotted lines in all graphs represent variation >30% between sides. Asterisks indicate significant differences (P < 0.05) on the injected side compared with the uninjected side analyzed by Student’s t test. Gapdh, glyceraldehyde 3-phosphate dehydrogenase.
Figure 3.
Figure 3.
PHD12 knockdown prevents neural crest emigration. (A and B) Electroporation of fluorescent PHD12-MO into the left side of the embryo has no effect on Snail2 immunoreactive premigratory neural crest cells at the 7ss. (C and D) However, at 9ss, the Snail2+ neural crest cells appear unable to migrate on the morpholino-treated compared with the right uninjected side. (D′) Transverse section at the level of dotted line in D. Bars: (A–D) 100 µm; (D′) 50 µm.
Figure 4.
Figure 4.
PHD12 knockdown prevents Cad6b down-regulation and neural crest emigration. (A–C) Confocal images of embryos treated with PHD12-MO reveal that Cad6b persists in the dorsal neural tube, at the midbrain level, and on the morpholino-treated side compared with the uninjected side. (D–F) Double immunohistochemistry shows that Cad6b expression is maintained, resulting in a paucity of migrating neural crest cells expressing FoxD3 on the PHD12-MO electroporated side (asterisks). (G–I) Transverse sections (G) and high magnification views of the dorsal neural tube (H and I) show colocalization of FoxD3- and Cad6b-expressing cells that appear unable to migrate on the injected side (arrowheads). Bars: (A–G) 50 µm; (H and I) 25 µm.
Figure 5.
Figure 5.
Coelectroporation of PHD12 mRNA or Cad6b morpholino rescues the lack of neural crest EMT caused by loss of PHD12. (A and B) Electroporation of PHD12-MO into the left side of the embryo (asterisks) causes a drastic reduction in the numbers of FoxD3-positive migrating neural crest cells compared with the uninjected side or with Ctrl-MO–treated embryo as assayed by immunohistochemistry. (C and D) Coelectroporation of PHD12-MO together with a vector containing the coding region of PHD12 (pCI-PHD12) restores the numbers of migrating FoxD3-positive neural crest cells. In contrast, coelectroporation of PHD12-MO plus an empty vector (pCI) fails to rescue the loss-of-function phenotype. (E and F) Coelectroporation of PHD12-MO together with a Cad6b-MO restores the migration of FoxD3-positive neural crest cells, whereas coelectroporation with control morpholino (L-Ctrl-MO) does not. (G) Quantitation of the phenotype based on the presence or absence of FoxD3-positive migrating neural crest cells compared with the contralateral side of the embryo. Asterisks indicate significant differences (P < 0.05) compared with each specific control by contingency table followed by χ2 test. Numbers represent analyzed embryos. Bar, 100 µm.
Figure 6.
Figure 6.
PHD12 protein interacts in vivo with Sin3A and indirectly with Snail2 as revealed by co-IP and BiFC. (A) Western blots using anti-Snail2 and -Sin3A on PHD12 or IgG immunoprecipitates (IP) from dorsal neural tubes from 6–8ss embryos. Input represent 0.1% of each IP. (B) Schematic representation of PHD12 constructs used for the bimolecular fluorescence complementation (BiFC) assay. (C and D) Visualization and quantification of BiFC on chick fibroblast transfected with PHD12 and truncated PHD12, Snail2, and Sin3A fused to the C or N terminus of Venus protein. Y axis on graph represents the fraction of transfected cells in which Venus fluorescence was visualized. Ct, C terminus; Nt, N terminus; FHA, Forkhead-associated domain; VC, Venus C terminus; VN, Venus N terminus; WB, Western blot. Error bars show SDs. Bar, 16 µm.
Figure 7.
Figure 7.
Endogenous PHD12 is recruited to the Cad6b promoter in vivo and is accompanied by histone 3 lysine deacetylation, correlating with the gene repression before neural crest EMT. ChIP assays were used to assess PHD12 binding and H3KAc to the Cad6b locus at different developmental stages. Two independent experiments were performed using 30 dorsal neural tubes for each stage. The vertical axis represents percentage of input (ChIP enriched/input), and horizontal axis represents different positions on the Cad6b locus. Schematic diagrams at top represent primer locations −2 kb from the transcription start site (TSS), the TSS, and the different E-boxes over the Cad6b gene. One representative sample is depicted per stage. (A) The results show no association of PHD12 on any analyzed regions of Cad6b at 4–5ss when compared with a distant, intergenic control region of the same chromosome 2 (Chr2nc). (B) In contrast, there is consistent PHD12 association with the Cad6b TSS at 7–9ss. (C) We also observed enhanced association using a different set of primers located at the Cad6b TSS. (D) H3Kac analysis shows high association at the TSS of Cad6b at 4–5ss but not in the other analyzed regions or the Chr2nc. (E) At 9–11ss, the H3KAc has low association values in all analyzed regions of Cad6b and the Chr2nc. (F) ChIP assay performed on 12 dorsal neural tube from PHD12-MO– and Snail2-MO–treated embryos sampled at 9–10ss shows a lack of deacetylation of the TSS of Cad6b gene compared with Ctrl-MO–treated embryos. See also Fig. S5 including IgG ChIP. Error bars show SDs.
Figure 8.
Figure 8.
Schematic model. The results suggest a model in which PHD12 and Snail2 associate with the TSS and E-boxes, respectively, on the Cad6b gene to recruit the Sin3A–HDAC repressive complex. This interaction allows the subsequent deacetylation of histone H3 at the promoter of the Cad6b gene, resulting in repression of its transcription. This in turn allows neural crest EMT. Ac, acetylation.

Similar articles

Cited by

References

    1. Adams M.S., Gammill L.S., Bronner-Fraser M. 2008. Discovery of transcription factors and other candidate regulators of neural crest development. Dev. Dyn. 237:1021–1033 10.1002/dvdy.21513 - DOI - PMC - PubMed
    1. Barrallo-Gimeno A., Nieto M.A. 2005. The Snail genes as inducers of cell movement and survival: implications in development and cancer. Development. 132:3151–3161 10.1242/dev.01907 - DOI - PubMed
    1. Batlle E., Sancho E., Francí C., Domínguez D., Monfar M., Baulida J., García De Herreros A. 2000. The transcription factor snail is a repressor of E-cadherin gene expression in epithelial tumour cells. Nat. Cell Biol. 2:84–89 10.1038/35000034 - DOI - PubMed
    1. Bienz M. 2006. The PHD finger, a nuclear protein-interaction domain. Trends Biochem. Sci. 31:35–40 10.1016/j.tibs.2005.11.001 - DOI - PubMed
    1. Bolós V., Peinado H., Pérez-Moreno M.A., Fraga M.F., Esteller M., Cano A. 2003. The transcription factor Slug represses E-cadherin expression and induces epithelial to mesenchymal transitions: a comparison with Snail and E47 repressors. J. Cell Sci. 116:499–511 10.1242/jcs.00224 - DOI - PubMed

Publication types

MeSH terms