

Red-shifted fluorescent proteins monitor enzymatic activity in live HT-1080 cells with fluorescence lifetime imaging microscopy (FLIM)
- PMID: 22971220
- PMCID: PMC3872149
- DOI: 10.1111/j.1365-2818.2012.03652.x
Red-shifted fluorescent proteins monitor enzymatic activity in live HT-1080 cells with fluorescence lifetime imaging microscopy (FLIM)
Abstract
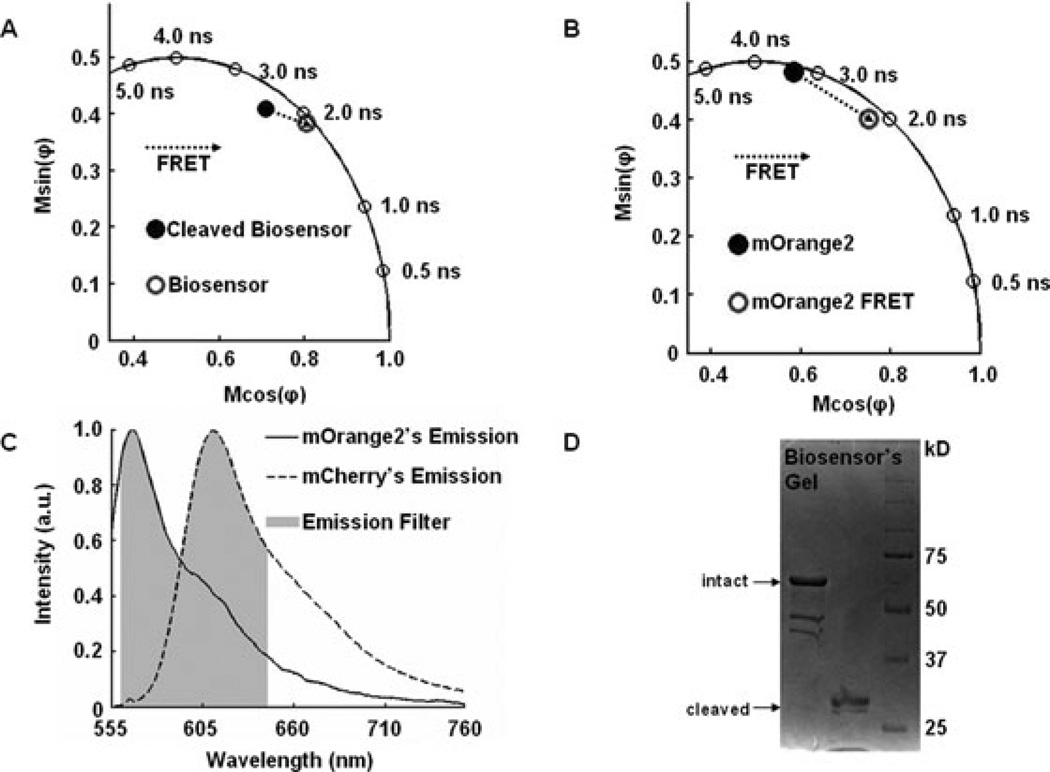
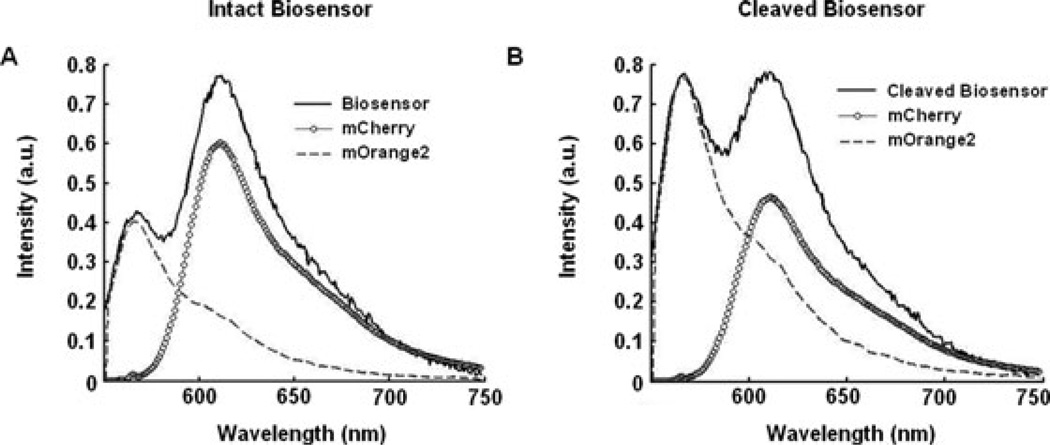
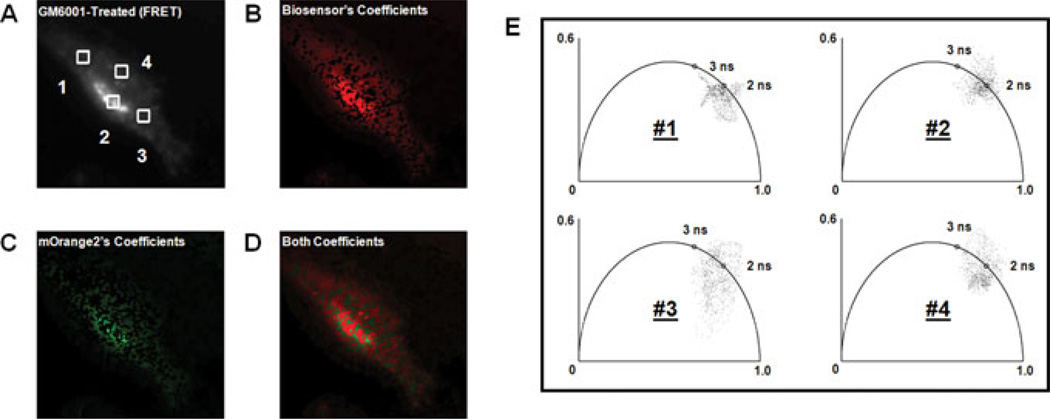
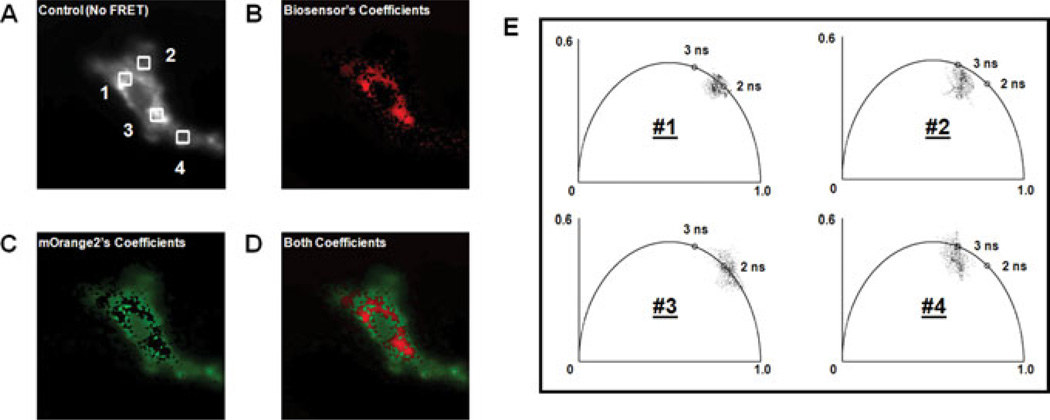
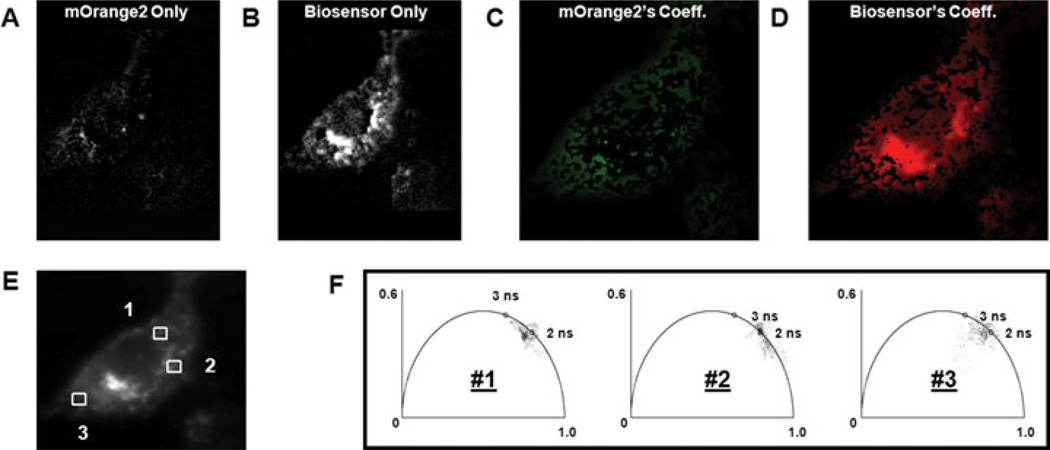
Membrane type 1 matrix metalloproteinase (MT1-MMP) is a membrane-tethered collagenase primarily involved in the mechanical destruction of extracellular matrix proteins. MT1-MMP has also been shown to be upregulated in several types of cancers. Many coordinated functions of MT1-MMP during migration and invasion remain to be determined. In this paper, live cells from the invasive cell line HT-1080 were imaged using an intracellular Förster resonance energy transfer-based biosensor specific for MT1-MMP; a substrate specific for MT1-MMP was hybridized with the mOrange2 and mCherry fluorescent proteins to form the Förster resonance energy transfer-based sensor. The configuration of the biosensor was determined with fluorescence lifetime-resolved imaging microscopy using both a polar plot-based analysis and a rapid data acquisition modality of fluorescence lifetime-resolved imaging microscopy known as phase suppression. Both configurations of the biosensor (with or without cleavage by MT1-MMP) were clearly resolvable in the same cell. Changes in the configuration of the MT1-MMP biosensor were observed primarily along the edge of the cell following the removal of the MMP inhibitor GM6001. The intensities highlighted by phase suppression correlated well with the fractional intensities derived from the polar plot.
© 2012 The Authors Journal of Microscopy © 2012 Royal Microscopical Society.
Figures

Similar articles
-
Phase differential enhancement of FLIM to distinguish FRET components of a biosensor for monitoring molecular activity of Membrane Type 1 Matrix Metalloproteinase in live cells.J Fluoresc. 2011 Jul;21(4):1763-77. doi: 10.1007/s10895-011-0871-x. Epub 2011 Apr 26. J Fluoresc. 2011. PMID: 21519891 Free PMC article.
-
Simultaneous visualization of protumorigenic Src and MT1-MMP activities with fluorescence resonance energy transfer.Cancer Res. 2010 Mar 15;70(6):2204-12. doi: 10.1158/0008-5472.CAN-09-3698. Epub 2010 Mar 2. Cancer Res. 2010. PMID: 20197470 Free PMC article.
-
Genetically encoded fluorescent biosensors for live-cell imaging of MT1-MMP protease activity.Methods Mol Biol. 2014;1071:163-74. doi: 10.1007/978-1-62703-622-1_13. Methods Mol Biol. 2014. PMID: 24052388 Free PMC article.
-
Monitoring biosensor activity in living cells with fluorescence lifetime imaging microscopy.Int J Mol Sci. 2012 Nov 7;13(11):14385-400. doi: 10.3390/ijms131114385. Int J Mol Sci. 2012. PMID: 23203070 Free PMC article. Review.
-
Phagocytosis of collagen by fibroblasts and invasive cancer cells is mediated by MT1-MMP.Biochem Soc Trans. 2007 Aug;35(Pt 4):704-6. doi: 10.1042/BST0350704. Biochem Soc Trans. 2007. PMID: 17635128 Review.
Cited by
-
Developments in preclinical cancer imaging: innovating the discovery of therapeutics.Nat Rev Cancer. 2014 May;14(5):314-28. doi: 10.1038/nrc3724. Epub 2014 Apr 17. Nat Rev Cancer. 2014. PMID: 24739578 Review.
-
Fluorescent proteins as genetically encoded FRET biosensors in life sciences.Sensors (Basel). 2015 Oct 16;15(10):26281-314. doi: 10.3390/s151026281. Sensors (Basel). 2015. PMID: 26501285 Free PMC article. Review.
References
-
- Birks J. Photophysics of Aromatic Molecules. New York: Wiley-Interscience; 1970.
-
- Buranachai C, Kamiyama D, Chiba A, Williams BD, Clegg RM. Rapid frequency-domain FLIM spinning disk confocal microscope: lifetime resolution, image improvement and wavelet analysis. J. Fluoresc. 2008;18:929–942. - PubMed
-
- Chen YC, Clegg RM. Spectral resolution in conjunction with polar plots improves the accuracy and reliability of FLIM measurements and estimates of FRET efficiencies. J. Microsc. 2011;244:21–37. - PubMed
-
- Clayton AH, Hanley QS, Verveer PJ. Graphical representation and multicomponent analysis of single-frequency fluorescence lifetime imaging microscopy data. J. Microsc. 2004;213:1–5. - PubMed
-
- Clegg RM. Fluorescence resonance energy transfer and nucleic acids. Methods Enzymol. 1992;211:353–388. - PubMed
Publication types
MeSH terms
Substances
Grants and funding
LinkOut - more resources
Full Text Sources
