. 2012 Nov;160(3):1597-612.
doi: 10.1104/pp.112.203968. Epub 2012 Sep 11.

Genomics and localization of the Arabidopsis DHHC-cysteine-rich domain S-acyltransferase protein family

Affiliations

Genomics and localization of the Arabidopsis DHHC-cysteine-rich domain S-acyltransferase protein family

Oliver Batistic. Plant Physiol. 2012 Nov.

Abstract

Protein lipid modification of cysteine residues, referred to as S-palmitoylation or S-acylation, is an important secondary and reversible modification that regulates membrane association, trafficking, and function of target proteins. This enzymatic reaction is mediated by protein S-acyl transferases (PATs). Here, the phylogeny, genomic organization, protein topology, expression, and localization pattern of the 24 PAT family members from Arabidopsis (Arabidopsis thaliana) is described. Most PATs are expressed at ubiquitous levels and tissues throughout the development, while few genes are expressed especially during flower development preferentially in pollen and stamen. The proteins display large sequence and structural variations but exhibit a common protein topology that is preserved in PATs from various organisms. Arabidopsis PAT proteins display a complex targeting pattern and were detected at the endoplasmic reticulum, Golgi, endosomal compartments, and the vacuolar membrane. However, most proteins were targeted to the plasma membrane. This large concentration of plant PAT activity to the plasma membrane suggests that the plant cellular S-acylation machinery is functionally different compared with that of yeast (Saccharomyces cerevisiae) and mammalians.


Figures
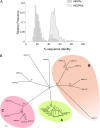
Figure 1.
Figure 1.
Sequence conservation and phylogeny of Arabidopsis PAT proteins. A, Sequence identity values (in percentages) of all Arabidopsis PAT protein pairs were determined, and the distribution (as relative frequency) of the sequence scores was plotted as a histogram (as bars). In comparison with that, the identity values obtained from the Arabidopsis CIPK protein gene family were plotted by the same method (as a filled line graph). Only a few AtPAT proteins show high sequence conservation (>60% identical amino acids), while all others share <60% identical amino acids. The sequence identities of most Arabidopsis PAT protein pairs range from only 10% to 30%. CIPK proteins mainly range from 40% to 60%. B, An NJ tree with collapsed branches (bootstrap values >75%) of Arabidopsis PAT proteins. The proteins are mainly clustered in three groups. Group A consists of the AtPATs 1 to 9, Group B of the AtPATs 11 to 16, and Group C of the AtPATs 18 to 22. The AtPATs 10, 17, 23, and 24 were not clearly positioned. AtPATs 23 and 24 are related proteins as both are on the same branch. Bootstrap values (in percentage values) are given for the respective nodes. The top number (percentage values from 0–100) represents the bootstrap factor obtained from the NJ analysis. The bottom number (percentage values given from 0–1) is the bootstrap factor obtained from a ML analysis. [See online article for color version of this figure.]
Figure 2.
Figure 2.
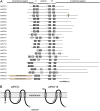
Alignment of Arabidopsis PAT proteins. A, Alignment overview of Arabidopsis PAT proteins. Light-gray lines/bars indicate the respective position of amino acid. Conserved amino acids were decorated using the ClustalX color code. In addition, coloring was performed group-wise (AtPATs 1–9, 10–17, 18–22, and 23–24) to identify conserved blocks within subgroups. Below, the histogram displays the degree of conservation (large yellow bar represents conserved amino acids). Only the central DHHC-CRD is highly conserved in all proteins. Upstream and downstream hydrophobic stretches are indicated as blue boxes (1–4), as well as the position of short, conserved peptide sequences (DPG in purple and NxTTxE in green), which follow the second and fourth hydrophobic stretch. AtPATs 1 to 9 contain a conserved N-terminal region that contains several basic and Gly residues (BG). A less conserved region was discovered in the C-terminal region, which in most proteins consists of the amino acid sequence NPYxxGxxxN. B, Alignment of the central DHHC-CRD domain. Coloring of conserved amino acids was performed according to the ClustalX specifications. Coloring was applied to all proteins as one group. Cys residues (orange) are invariant amino acids, as well as the central DHHC peptide. The DHHC peptide is followed by a hydrophobic stretch of amino acids. Further upstream, a [KR]PPR peptide is nearly conserved in all Arabidopsis PATs but missing in the PAT group 18–22. Number range after the protein name and diagonal slash (e.g. 141–210 in AtPAT01) give the amino acid positions within the protein. Numbers above the alignment give the position of an amino acid within the alignment. [See online article for color version of this figure.]
Figure 3.
Figure 3.
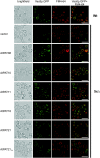
Targeting of Vac8p to the yeast vacuolar membrane in yeast mutant cells by Arabidopsis PATs. Vac8p.GFP is targeted to the vacuolar membrane in wild-type cells (Wt; indicated on the right). In the 5xΔ strain (indicated on the right) containing the empty plasmid as a control (vector, indicated on the left), Vac8p.GFP associates with ER structures. Expression of AtPATs (indicated on the left) can retarget Vac8p.GFP back to the vacuolar membrane, while the PAT21CA mutant is not able to retarget Vac8p. First row shows a bright-field picture, and the GFP fluorescence is depicted in the second row. FM4-64 staining of the yeast vacuole is shown in the third row, which was merged with the GFP fluorescence picture (shown in the last row). Bars = 10 µm. [See online article for color version of this figure.]
Figure 4.
Figure 4.
Protein topology of Arabidopsis PATs. A, Overview of the protein topology of Arabidopsis PAT proteins. Given are the relative positions of the potential TMDs and the variable N- and C-terminal regions. The central region contains the DHHC sequence (gray triangle) in the vicinity of the C-terminal TMDs. Black boxes represent predicted TMDs (with support values in percent, given from 0–1). Light-gray boxes represent further hydrophobic domains, which likely do not represent TMDs (support value <0.5). The identified ankyrin domains are shown for the AtPATs 23 and 24 in the N-terminal region. The box within the C-terminal region of AtPAT4 represents a His-rich region. Bar represents 100 amino acids. B, Proposed protein topology of Arabidopsis PATs within the membrane. Most PATs contain two TMDs upstream of the central region (AtPATx). In general, the N terminus, the central DHHC-CRD (DHHC), and the C terminus are directed to the cytosol. AtPAT15 likely contains only one predicted TMD, which is preceding the DHHC-CRD. To direct the active site to the cytosol, the N terminus has to be secreted. [See online article for color version of this figure.]
Figure 5.
Figure 5.
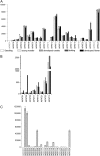
Expression of Arabidopsis PATs. A, Global expression values of Arabidopsis PATs obtained from Genevestigator at different developmental stages (seedling, white bar; young rosette, light-gray bar; developed rosette, medium-gray bar; stem, dark-gray bar; flowers, black bar). Note that the AtPATs 1, 11, 19, and 23 are not present on the ATH1 microarray chip. Bars represent mean values. Error bars represent sd. B, Expression of the AtPATs 1, 2, 3, 11, 19, 21, and 23 was compared with the expression of AtPAT13 at different developmental stages (seedling, white bar; young rosette, light-gray bar; developed rosette, medium-gray bar; stem, dark-gray bar; flowers, black bar). Values were obtained from At-TEX using TileViz. C, Expression values of PATs in Arabidopsis pollen obtained from Genevestigator based on ATH1 microarray analysis. Bars represent mean values. Error bars represent sd.
Figure 6.
Figure 6.
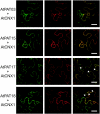
ER localization of the Arabidopsis PATs 3, 15, 17, and 18. PAT.GFP fusions were transiently expressed in N. benthamiana leaves, and fluorescence is shown at the left. PATs were coexpressed with mCherry.CNX1 shown in the middle. The merged fluorescence is shown at the right. Arrows indicate the vesicle observed for PAT.GFP fusions. Bars, shown in the merged picture, = 20 µm. [See online article for color version of this figure.]
Figure 7.
Figure 7.
Localization of the Arabidopsis PATs 16, 23, 14, 24, 1, and 2. AtPAT.GFP fusions were transiently expressed in N. benthamiana leaves (left) and coexpressed with AtGNT1.mCherry (middle). The merged fluorescence is shown at the right. Bars, shown in the merged picture, = 20 µm. [See online article for color version of this figure.]
Figure 8.
Figure 8.
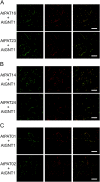
Localization of the Arabidopsis PATs 10 and 11. AtPAT.GFP fusions were transiently expressed in N. benthamiana leaves, and fluorescence is shown at the left. AtPAT10 was coexpressed with GNT1.mCherry (A) and TPK1.mCherry (B). A higher gain was used to enhance green fluorescence in (B) compared with (A) to better display the vacuolar membrane (arrows). AtPAT11 was coexpressed with TPK1.mCherry (C). Both decorated the vacuolar membrane and vesicles (arrows). All coexpressed mCherry fused proteins are shown in the middle. The merged fluorescence is shown at the right. Bars, shown in the merged picture = 20 µm. [See online article for color version of this figure.]
Figure 9.
Figure 9.
PM localizations of the Arabidopsis PATs 4 to 9, 12-13, and 19 to 22. The Arabidopsis PATs fused to GFP (left) were transiently expressed in N. benthamiana leaves with CBL1n.OFP (middle). The merged fluorescence is shown at the right. Bars, shown in the merged picture, = 20 µm. [See online article for color version of this figure.]

Similar articles

Cited by

References

    1. Abrami L, Leppla SH, van der Goot FG. (2006) Receptor palmitoylation and ubiquitination regulate anthrax toxin endocytosis. J Cell Biol 172: 309–320 - PMC - PubMed
    1. Adjobo-Hermans MJ, Goedhart J, Gadella TW., Jr (2006) Plant G protein heterotrimers require dual lipidation motifs of Gα and Gγ and do not dissociate upon activation. J Cell Sci 119: 5087–5097 - PubMed
    1. Altschul SF, Gish W, Miller W, Myers EW, Lipman DJ. (1990) Basic local alignment search tool. J Mol Biol 215: 403–410 - PubMed
    1. Baekkeskov S, Kanaani J. (2009) Palmitoylation cycles and regulation of protein function (Review). Mol Membr Biol 26: 42–54 - PubMed
    1. Bannan BA, Van Etten J, Kohler JA, Tsoi Y, Hansen NM, Sigmon S, Fowler E, Buff H, Williams TS, Ault JG, et al. (2008) The Drosophila protein palmitoylome: characterizing palmitoyl-thioesterases and DHHC palmitoyl-transferases. Fly (Austin) 2: 198–214 - PMC - PubMed

Publication types

MeSH terms

LinkOut - more resources