

Stimulus bias provides evidence for conformational constraints in the structure of a G protein-coupled receptor
- PMID: 22965232
- PMCID: PMC3481307
- DOI: 10.1074/jbc.M112.408534
Stimulus bias provides evidence for conformational constraints in the structure of a G protein-coupled receptor
Abstract
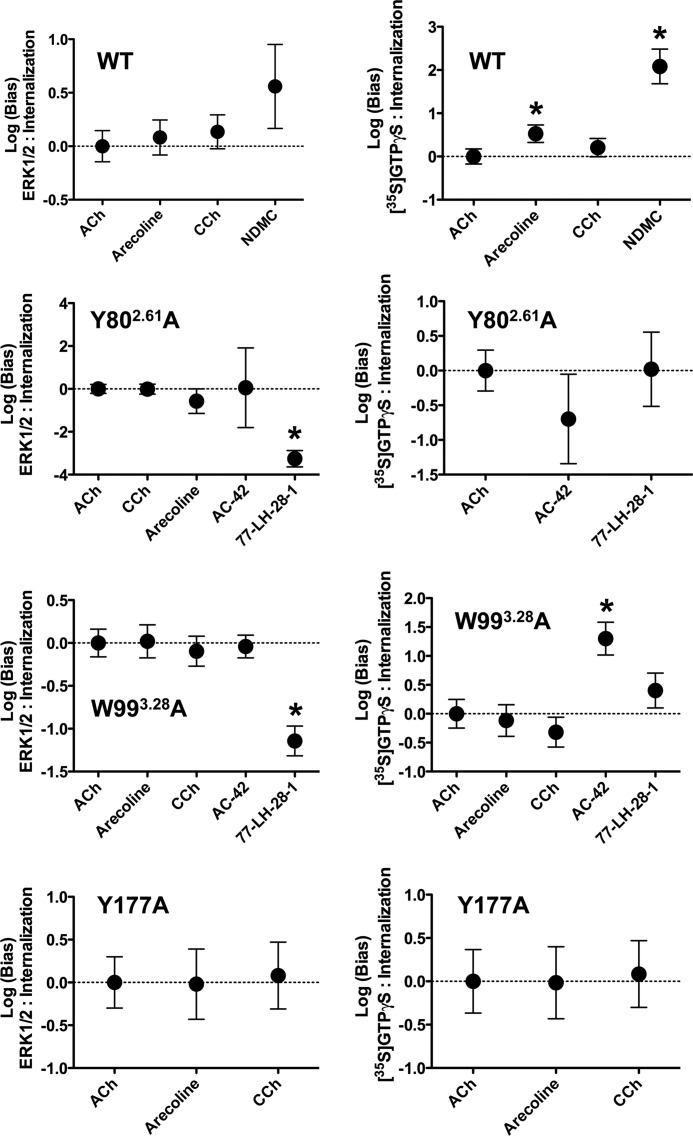
A key characteristic of G protein-coupled receptors (GPCRs) is that they activate a plethora of signaling pathways. It is now clear that a GPCR coupling to these pathways can be regulated selectively by ligands that differentially drive signaling down one pathway in preference to another. This concept, termed stimulus bias, is revolutionizing receptor biology and drug discovery by providing a means of selectively targeting receptor signaling pathways that have therapeutic impact. Herein, we utilized a novel quantitative method that determines stimulus bias of synthetic GPCR ligands in a manner that nullifies the impact of both the cellular background and the "natural bias" of the endogenous ligand. By applying this method to the M(2) muscarinic acetylcholine receptor, a prototypical GPCR, we found that mutation of key residues (Tyr-80(2.61) and Trp-99(3.28)) in an allosteric binding pocket introduces stimulus bias in response to the atypical ligands AC-42 (4-n-butyl-1-(4-(2-methylphenyl)-4-oxo-1-butyl)piperidine HCl) and 77-LH-28-1 (1-(3-(4-butyl-1-piperidinyl)propyl)- 3,3-dihydro-2(1H)-quinolinone). By comparing stimulus bias factors among receptor internalization, G protein activation, extracellular-regulated protein kinase 1/2 (ERK1/2) signaling, and receptor phosphorylation, we provide evidence that Tyr-80(2.61) and Trp-99(3.28) act either as molecular switches or as gatekeeper residues that introduce constraints limiting the active conformation of the M(2) muscarinic acetylcholine receptor and thereby regulate stimulus bias. Furthermore, we provide evidence that downstream signaling pathways previously considered to be related to each other (i.e. receptor phosphorylation, internalization, and activation of ERK1/2) can act independently.
Figures


Similar articles
-
Identification of orthosteric and allosteric site mutations in M2 muscarinic acetylcholine receptors that contribute to ligand-selective signaling bias.J Biol Chem. 2010 Mar 5;285(10):7459-74. doi: 10.1074/jbc.M109.094011. Epub 2010 Jan 5. J Biol Chem. 2010. PMID: 20051519 Free PMC article.
-
Structure-function studies of allosteric agonism at M2 muscarinic acetylcholine receptors.Mol Pharmacol. 2007 Aug;72(2):463-76. doi: 10.1124/mol.107.037630. Epub 2007 May 24. Mol Pharmacol. 2007. PMID: 17525129
-
Contrasting effects of allosteric and orthosteric agonists on m1 muscarinic acetylcholine receptor internalization and down-regulation.J Pharmacol Exp Ther. 2009 Dec;331(3):1086-95. doi: 10.1124/jpet.109.160242. Epub 2009 Sep 18. J Pharmacol Exp Ther. 2009. PMID: 19767446 Free PMC article.
-
Dualsteric GPCR targeting and functional selectivity: the paradigmatic M(2) muscarinic acetylcholine receptor.Drug Discov Today Technol. 2013 Summer;10(2):e245-52. doi: 10.1016/j.ddtec.2012.12.003. Drug Discov Today Technol. 2013. PMID: 24050275 Review.
-
Regulation of signal transduction at M2 muscarinic receptor.Physiol Res. 2004;53 Suppl 1:S131-40. Physiol Res. 2004. PMID: 15119944 Review.
Cited by
-
Molecular mechanisms of bitopic ligand engagement with the M1 muscarinic acetylcholine receptor.J Biol Chem. 2014 Aug 22;289(34):23817-37. doi: 10.1074/jbc.M114.582874. Epub 2014 Jul 8. J Biol Chem. 2014. PMID: 25006252 Free PMC article.
-
Family C G-Protein-Coupled Receptors in Alzheimer's Disease and Therapeutic Implications.Front Pharmacol. 2019 Oct 28;10:1282. doi: 10.3389/fphar.2019.01282. eCollection 2019. Front Pharmacol. 2019. PMID: 31719824 Free PMC article. Review.
-
Signaling within Allosteric Machines: Signal Transmission Pathways Inside G Protein-Coupled Receptors.Molecules. 2017 Jul 15;22(7):1188. doi: 10.3390/molecules22071188. Molecules. 2017. PMID: 28714871 Free PMC article. Review.
-
Mechanistic analysis of the function of agonists and allosteric modulators: reconciling two-state and operational models.Br J Pharmacol. 2013 Jul;169(6):1189-202. doi: 10.1111/bph.12231. Br J Pharmacol. 2013. PMID: 23647200 Free PMC article. Review.
-
β2-Adrenoceptor-mediated regulation of glucose uptake in skeletal muscle--ligand-directed signalling or a reflection of system complexity?Naunyn Schmiedebergs Arch Pharmacol. 2013 Sep;386(9):757-60. doi: 10.1007/s00210-013-0879-7. Epub 2013 May 9. Naunyn Schmiedebergs Arch Pharmacol. 2013. PMID: 23657252
References
-
- M. C., H. B. (2008) Structural diversity of G protein-coupled receptors and significance for drug discovery. Nat. Rev. Drug Discov. 7, 339–357 - PubMed
-
- Overington J. P., Al-Lazikani B., Hopkins A. L. (2006) How many drug targets are there? Nat. Rev. Drug Discov. 5, 993–996 - PubMed
-
- Lefkowitz R. J. (2004) Historical review: a brief history and personal retrospective of seven-transmembrane receptors. Trends Pharmacol. Sci. 25, 413–422 - PubMed
-
- Kenakin T. (2005) New concepts in drug discovery: collateral efficacy and permissive antagonism. Nat. Rev. Drug Discov. 4, 919–927 - PubMed
Publication types
MeSH terms
Substances
Grants and funding
LinkOut - more resources
Full Text Sources
Miscellaneous
