A comprehensive comparison of RNA-Seq-based transcriptome analysis from reads to differential gene expression and cross-comparison with microarrays: a case study in Saccharomyces cerevisiae
- PMID: 22965124
- PMCID: PMC3488244
- DOI: 10.1093/nar/gks804
A comprehensive comparison of RNA-Seq-based transcriptome analysis from reads to differential gene expression and cross-comparison with microarrays: a case study in Saccharomyces cerevisiae
Abstract
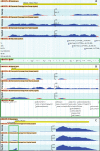
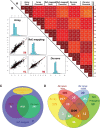
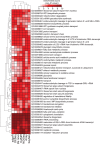
RNA-seq, has recently become an attractive method of choice in the studies of transcriptomes, promising several advantages compared with microarrays. In this study, we sought to assess the contribution of the different analytical steps involved in the analysis of RNA-seq data generated with the Illumina platform, and to perform a cross-platform comparison based on the results obtained through Affymetrix microarray. As a case study for our work we, used the Saccharomyces cerevisiae strain CEN.PK 113-7D, grown under two different conditions (batch and chemostat). Here, we asses the influence of genetic variation on the estimation of gene expression level using three different aligners for read-mapping (Gsnap, Stampy and TopHat) on S288c genome, the capabilities of five different statistical methods to detect differential gene expression (baySeq, Cuffdiff, DESeq, edgeR and NOISeq) and we explored the consistency between RNA-seq analysis using reference genome and de novo assembly approach. High reproducibility among biological replicates (correlation≥0.99) and high consistency between the two platforms for analysis of gene expression levels (correlation≥0.91) are reported. The results from differential gene expression identification derived from the different statistical methods, as well as their integrated analysis results based on gene ontology annotation are in good agreement. Overall, our study provides a useful and comprehensive comparison between the two platforms (RNA-seq and microrrays) for gene expression analysis and addresses the contribution of the different steps involved in the analysis of RNA-seq data.
Figures


Similar articles
-
Whole genome sequencing of Saccharomyces cerevisiae: from genotype to phenotype for improved metabolic engineering applications.BMC Genomics. 2010 Dec 22;11:723. doi: 10.1186/1471-2164-11-723. BMC Genomics. 2010. PMID: 21176163 Free PMC article.
-
Evaluating gene expression in C57BL/6J and DBA/2J mouse striatum using RNA-Seq and microarrays.PLoS One. 2011 Mar 24;6(3):e17820. doi: 10.1371/journal.pone.0017820. PLoS One. 2011. PMID: 21455293 Free PMC article.
-
Complete genomic and transcriptional landscape analysis using third-generation sequencing: a case study of Saccharomyces cerevisiae CEN.PK113-7D.Nucleic Acids Res. 2018 Apr 20;46(7):e38. doi: 10.1093/nar/gky014. Nucleic Acids Res. 2018. PMID: 29346625 Free PMC article.
-
Statistical detection of differentially expressed genes based on RNA-seq: from biological to phylogenetic replicates.Brief Bioinform. 2016 Mar;17(2):243-8. doi: 10.1093/bib/bbv035. Epub 2015 Jun 24. Brief Bioinform. 2016. PMID: 26108230 Review.
-
Comprehensive Assessments of RNA-seq by the SEQC Consortium: FDA-Led Efforts Advance Precision Medicine.Pharmaceutics. 2016 Mar 15;8(1):8. doi: 10.3390/pharmaceutics8010008. Pharmaceutics. 2016. PMID: 26999190 Free PMC article. Review.
Cited by
-
Multi-omic data integration and analysis using systems genomics approaches: methods and applications in animal production, health and welfare.Genet Sel Evol. 2016 Apr 29;48(1):38. doi: 10.1186/s12711-016-0217-x. Genet Sel Evol. 2016. PMID: 27130220 Free PMC article. Review.
-
Transcriptional reprogramming underpins enhanced plant growth promotion by the biocontrol fungus Trichoderma hamatum GD12 during antagonistic interactions with Sclerotinia sclerotiorum in soil.Mol Plant Pathol. 2016 Dec;17(9):1425-1441. doi: 10.1111/mpp.12429. Epub 2016 Jul 24. Mol Plant Pathol. 2016. PMID: 27187266 Free PMC article.
-
Aberrantly expressed microRNAs in the context of bladder tumorigenesis.Investig Clin Urol. 2016 Jun;57 Suppl 1(Suppl 1):S52-9. doi: 10.4111/icu.2016.57.S1.S52. Epub 2016 Jun 10. Investig Clin Urol. 2016. PMID: 27326408 Free PMC article. Review.
-
Integrative RNA-seq and microarray data analysis reveals GC content and gene length biases in the psoriasis transcriptome.Physiol Genomics. 2014 Aug 1;46(15):533-46. doi: 10.1152/physiolgenomics.00022.2014. Epub 2014 May 20. Physiol Genomics. 2014. PMID: 24844236 Free PMC article.
-
RNA-Seq gene profiling--a systematic empirical comparison.PLoS One. 2014 Sep 30;9(9):e107026. doi: 10.1371/journal.pone.0107026. eCollection 2014. PLoS One. 2014. PMID: 25268973 Free PMC article.
References
-
- Wilhelm BT, Landry JR. RNA-Seq-quantitative measurement of expression through massively parallel RNA-sequencing. Methods. 2009;48:249–257. - PubMed
Publication types
MeSH terms
Associated data
Grants and funding
LinkOut - more resources
Full Text Sources
Other Literature Sources
Molecular Biology Databases
Research Materials

