Force-induced fibronectin assembly and matrix remodeling in a 3D microtissue model of tissue morphogenesis
- PMID: 22961409
- PMCID: PMC3586566
- DOI: 10.1039/c2ib20059g
Force-induced fibronectin assembly and matrix remodeling in a 3D microtissue model of tissue morphogenesis
Abstract
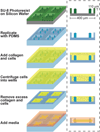
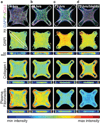
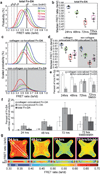
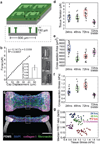
Encapsulations of cells in type-I collagen matrices are widely used three-dimensional (3D) in vitro models of wound healing and tissue morphogenesis and are common constructs for drug delivery and for in vivo implantation. As cells remodel the exogenous collagen scaffold, they also assemble a dense fibronectin (Fn) matrix that aids in tissue compaction; however, the spatio-temporal (re)organization of Fn and collagen in this setting has yet to be quantitatively investigated. Here, we utilized microfabricated tissue gauges (μTUGs) to guide the contraction of microscale encapsulations of fibroblasts within collagen gels. We combined this system with a Foerster Radius Energy Transfer (FRET) labeled biosensor of Fn conformation to probe the organization, conformation and remodeling of both the exogenous collagen and the cell-assembled Fn matrices. We show that within hours, compact Fn from culture media adsorbed to the collagen scaffold. Over the course of tissue remodeling, this Fn-coated collagen scaffold was compacted into a thin, sparsely populated core around which cells assembled a dense fibrillar Fn shell that was rich in both cell and plasma derived Fn. This resulted in two separate Fn populations with different conformations (compact/adsorbed and extended/fibrillar) in microtissues. Cell contractility and microtissue geometry cooperated to remodel these two populations, resulting in spatial gradients in Fn conformation. Together, these results highlight an important spatio-temporal interplay between two prominent extracellular matrix (ECM) molecules (Fn and collagen) and cellular traction forces, and will have implications for future studies of the force-mediated remodeling events that occur within collagen scaffolds either in 3D in vitro models or within surgical implants in vivo.
Figures

Similar articles
-
Full-Length Fibronectin Drives Fibroblast Accumulation at the Surface of Collagen Microtissues during Cell-Induced Tissue Morphogenesis.PLoS One. 2016 Aug 26;11(8):e0160369. doi: 10.1371/journal.pone.0160369. eCollection 2016. PLoS One. 2016. PMID: 27564551 Free PMC article.
-
The interplay of fibronectin functionalization and TGF-β1 presence on fibroblast proliferation, differentiation and migration in 3D matrices.Biomater Sci. 2015 Sep;3(9):1291-301. doi: 10.1039/c5bm00140d. Biomater Sci. 2015. PMID: 26230292
-
Disentangling the multifactorial contributions of fibronectin, collagen and cyclic strain on MMP expression and extracellular matrix remodeling by fibroblasts.Matrix Biol. 2014 Nov;40:62-72. doi: 10.1016/j.matbio.2014.09.001. Epub 2014 Sep 11. Matrix Biol. 2014. PMID: 25217861
-
Collagen Assembly at the Cell Surface: Dogmas Revisited.Cells. 2021 Mar 16;10(3):662. doi: 10.3390/cells10030662. Cells. 2021. PMID: 33809734 Free PMC article. Review.
-
The retention and ultrastructural appearances of various extracellular matrix molecules incorporated into three-dimensional hydrated collagen lattices.Dev Biol. 1985 Jun;109(2):347-69. doi: 10.1016/0012-1606(85)90461-0. Dev Biol. 1985. PMID: 2581830 Review.
Cited by
-
Lighting Up the Force: Investigating Mechanisms of Mechanotransduction Using Fluorescent Tension Probes.Mol Cell Biol. 2015 Aug;35(15):2570-82. doi: 10.1128/MCB.00195-15. Epub 2015 Jun 1. Mol Cell Biol. 2015. PMID: 26031334 Free PMC article. Review.
-
Cellular forces and matrix assembly coordinate fibrous tissue repair.Nat Commun. 2016 Mar 16;7:11036. doi: 10.1038/ncomms11036. Nat Commun. 2016. PMID: 26980715 Free PMC article.
-
Distinct effects of different matrix proteoglycans on collagen fibrillogenesis and cell-mediated collagen reorganization.Sci Rep. 2020 Nov 4;10(1):19065. doi: 10.1038/s41598-020-76107-0. Sci Rep. 2020. PMID: 33149218 Free PMC article.
-
Quantitative approaches to uncover physical mechanisms of tissue morphogenesis.Curr Opin Biotechnol. 2013 Oct;24(5):954-61. doi: 10.1016/j.copbio.2013.04.006. Epub 2013 May 4. Curr Opin Biotechnol. 2013. PMID: 23647971 Free PMC article. Review.
-
Surface and Bulk Stresses Drive Morphological Changes in Fibrous Microtissues.Biophys J. 2019 Sep 3;117(5):975-986. doi: 10.1016/j.bpj.2019.07.041. Epub 2019 Jul 31. Biophys J. 2019. PMID: 31427068 Free PMC article.
References
-
- Grinnell F, Petroll WM. Cell motility and mechanics in three-dimensional collagen matrices. Annu. Rev. Cell Dev. Biol. 2010;26:335–361. - PubMed
- Nakagawa S, Pawelek P, Grinnell F. Extracellular matrix organization modulates fibroblast growth and growth factor responsiveness. Exp. Cell Res. 1989;182:572–582. - PubMed
- Stopak D, Harris AK. Connective tissue morphogenesis by fibroblast traction. I. Tissue culture observations. Dev. Biol. (Amsterdam, Neth.) 1982;90:383–398. - PubMed
- Stopak D, Wessells NK, Harris AK. Morphogenetic rearrangement of injected collagen in developing chicken limb buds. Proc. Natl. Acad. Sci. U. S. A. 1985;82:2804–2808. - PMC - PubMed
-
- Eschenhagen T, Fink C, Remmers U, Scholz H, Wattchow J, Weil J, Zimmermann W, Dohmen HH, Schafer H, Bishopric N, Wakatsuki T, Elson EL. Three-dimensional reconstitution of embryonic cardiomyocytes in a collagen matrix: a new heart muscle model system. FASEB J. 1997;11:683–694. - PubMed
- Wallace DG, Rosenblatt J. Collagen gel systems for sustained delivery and tissue engineering. Adv. Drug Delivery Rev. 2003;55:1631–1649. - PubMed
- Zimmermann WH, Melnychenko I, Wasmeier G, Didie M, Naito H, Nixdorff U, Hess A, Budinsky L, Brune K, Michaelis B, Dhein S, Schwoerer A, Ehmke H, Eschenhagen T. Engineered heart tissue grafts improve systolic and diastolic function in infarcted rat hearts. Nat. Med. 2006;12:452–458. - PubMed
-
- Adachi Y, Mio T, Takigawa K, Striz I, Romberger DJ, Spurzem JR, Rennard SI. Fibronectin production by cultured human lung fibroblasts in three-dimensional collagen gel culture. In Vitro Cell. Dev. Biol.: Anim. 1998;34:203–210. - PubMed
-
- Davenport EA, Nettesheim P. Type I collagen gel modulates extracellular matrix synthesis and deposition by tracheal epithelial cells. Exp. Cell Res. 1996;223:155–162. - PubMed
Publication types
MeSH terms
Substances
Grants and funding
LinkOut - more resources
Full Text Sources
Research Materials
Miscellaneous

