. 2012 Sep;22(9):1775-89.
doi: 10.1101/gr.132159.111.

The GENCODE v7 catalog of human long noncoding RNAs: analysis of their gene structure, evolution, and expression

Affiliations

The GENCODE v7 catalog of human long noncoding RNAs: analysis of their gene structure, evolution, and expression

Thomas Derrien et al. Genome Res. 2012 Sep.

Abstract

The human genome contains many thousands of long noncoding RNAs (lncRNAs). While several studies have demonstrated compelling biological and disease roles for individual examples, analytical and experimental approaches to investigate these genes have been hampered by the lack of comprehensive lncRNA annotation. Here, we present and analyze the most complete human lncRNA annotation to date, produced by the GENCODE consortium within the framework of the ENCODE project and comprising 9277 manually annotated genes producing 14,880 transcripts. Our analyses indicate that lncRNAs are generated through pathways similar to that of protein-coding genes, with similar histone-modification profiles, splicing signals, and exon/intron lengths. In contrast to protein-coding genes, however, lncRNAs display a striking bias toward two-exon transcripts, they are predominantly localized in the chromatin and nucleus, and a fraction appear to be preferentially processed into small RNAs. They are under stronger selective pressure than neutrally evolving sequences-particularly in their promoter regions, which display levels of selection comparable to protein-coding genes. Importantly, about one-third seem to have arisen within the primate lineage. Comprehensive analysis of their expression in multiple human organs and brain regions shows that lncRNAs are generally lower expressed than protein-coding genes, and display more tissue-specific expression patterns, with a large fraction of tissue-specific lncRNAs expressed in the brain. Expression correlation analysis indicates that lncRNAs show particularly striking positive correlation with the expression of antisense coding genes. This GENCODE annotation represents a valuable resource for future studies of lncRNAs.


Figures

Figure 1.
Figure 1.
Manual annotation of lncRNAs in the human genome. (A) How lncRNAs were subclassified based on intersection with protein-coding genes. Priority was assigned to protein-coding exonic intersect over intronic or overlapping. Then, in cases where multiple protein-coding transcripts could be chosen, the protein-coding transcript having the longest intersect with the lncRNA was considered the best partner over the others (see Methods). (B) Number of lncRNA transcripts per subcategory. (S) Same sense; (AS) antisense.
Figure 2.
Figure 2.
GENCODE lncRNAs are independent, noncoding transcripts. (A) Protein-coding potential of transcripts computed in four data sets: protein-coding (red), GENCODE v7 lncRNAs (blue), decoy lncRNAs (green), and known lncRNAs (XIST, H19…) (purple). (B) Proportion of GENCODE lncRNAs and mRNAs transcripts with CAGE clusters mapped around their transcription start sites (TSSs) (see Methods) in bins of increasing expression levels (log10 RPKM).
Figure 3.
Figure 3.
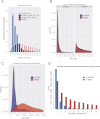
Features of lncRNA gene structure. (A) Number of exons per transcripts for all lncRNA transcripts (light blue), lncRNAs having CAGE or PET supports for either their 5′ or 3′ ends (blue), lncRNAs having PET tags mapping to both ends of the transcript (dark blue), and protein-coding transcripts (red). (B) Exon (left) and intron (right) size distributions for lncRNA and mRNAs. (C) Processed transcript size distributions of lncRNAs (blue) and protein-coding (red). (D) Distribution of the number of alternative spliced forms per lncRNA (blue) and protein-coding (red) gene locus.
Figure 4.
Figure 4.
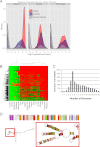
Evolutionary conservation of lncRNAs. (A) Density plots of phastCons score distributions of protein genes (red curves), lncRNA genes (blue curves), and ancestral repeats (gray curve) for exons (left), introns (middle), and promoters (right). (B) Human lncRNA conservation in mammals: The heatmap summarizes the lncRNA orthologs discovered in 18 other mammalian genomes (see Methods). (Columns) Mammal species. (Rows) Query lncRNAs. The color scheme reflects the level of sequence similarity (percent identity) measured between query and target homologs. (Red) No reliable homolog was detected. (C) The number of orthologs discovered for each lncRNA. LnRNAs with zero orthologs are those that could not be reliably remapped to the human genome at the levels of stringency used in the analysis, due to high repeat content. (D) Example of a multiple sequence alignment of a five-member family. The position containing compensated mutations are labeled by orange columns (correlated) and red columns (correlated Watson-Crick). (Yellow columns) Perfect Watson-Crick matches; (green columns) neutral matches (including G-U pairs); (blue columns) incompatible matches. The putative 2D consensus structure shown is based on the full multiple sequence alignment (RNAaliFold minimum folding energy). (Red box) Details of the 2D structure, with the precise location of the groups of compensated mutations. The colors associated with the residues indicate mutational pattern with respect to the structure as reported by RNAalifold.
Figure 5.
Figure 5.
Characteristics of lncRNA expression in human tissues. (A) Distributions of lncRNA (blue) and protein-coding (red) transcripts' expression (log10 RPKM) in HBM tissues. (B) Distribution of the number of HBM tissues in which lncRNA and protein-coding transcripts' are detected (RPKM > 0.1).
Figure 6.
Figure 6.
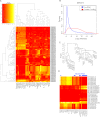
Microarray analysis of lncRNA expression in the human body. (A) The heatmap shows expression of the 121 most variably expressed lncRNAs (rows), defined as those with a coefficient of variation >0.2 across 31 cell/tissue types (columns). In the color scheme, yellow indicates higher expression, red indicates lower expression. (B) The intensity distribution of lncRNAs compared with protein-coding mRNAs. The data from GM12878 cells are shown, but similar results were observed in all samples. (C) A tree of expression correlation between samples; correlations were calculated using the expression of all lncRNAs in each sample. (D) The expression pattern of known lncRNAs. RNAs were manually curated from the literature. (Blue bars) Those RNA samples that do not contain any female component. Each row corresponds to a lncRNA transcript, and most lncRNA genes are represented on the array by several different transcript isoforms, resulting in multiple entries per lncRNA.
Figure 7.
Figure 7.
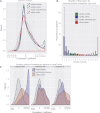
Correlation of expression of lncRNAs and protein-coding transcripts. (A) Correlations of expression of all-against-all genes from different data sets involving trans-pairs of genes. (B) The breadth of expression for trans-pairs having a highly correlated profile of expression (rs > 0.9). (C) Correlations of expression of intersected genes for different categories: Intron AS (intronic antisense), intron S (intronic sense), and exonic AS (exonic antisense).
Figure 8.
Figure 8.
LncRNAs are enriched in the cell nucleus and chromatin. (A) Shown are the chromatin/cytoplasm expression ratios of lncRNAs and protein-coding transcripts in K562 cells. Data are represented as log10-transformed ratios of RPKM values (log10[chromatin RPKM/cytoplasm RPKM]). The data correspond to the 310 lncRNA and 10,287 protein-coding transcripts that fall below a 0.1 IDR threshold in both nuclear and chromatin data. (B) The boxplot, similar to that in A, shows the nucleus/cytoplasm expression ratios for the six ENCODE cell lines where data is available. Between 290 and 758 lncRNAs passed IDR cutoff and are shown, compared with between 16,561 and 20,666 protein-coding transcripts. (C) Nuclear enrichment of lncRNAs is correlated between cell types. The heatmap shows pairwise Pearson correlation values for the set of 98 lncRNA transcripts that passed IDR cutoff in all six ENCODE cell lines. Correlation was calculated for the nuclear/cytoplasmic enrichment value for this set of transcripts between each pair of cells. (D) Subcellular localization of known lncRNAs. The set of known lncRNAs was manually curated from the literature and lncRNAdb database (Amaral et al. 2011). (Not detected) The RPKM values did not meet the IDR 0.1 threshold.

Similar articles

Cited by

References

    1. Alioto TS 2007. U12DB: A database of orthologous U12-type spliceosomal introns. Nucleic Acids Res 35: D110–D115 - PMC - PubMed
    1. Altschul SF, Gish W, Miller W, Myers EW, Lipman DJ 1990. Basic local alignment search tool. J Mol Biol 215: 403–410 - PubMed
    1. Amaral PP, Clark MB, Gascoigne DK, Dinger ME, Mattick JS 2011. lncRNAdb: A reference database for long noncoding RNAs. Nucleic Acids Res 39: D146–D151 - PMC - PubMed
    1. Aoki K, Harashima A, Sano M, Yokoi T, Nakamura S, Kibata M, Hirose T 2010. A thymus-specific noncoding RNA, Thy-ncR1, is a cytoplasmic riboregulator of MFAP4 mRNA in immature T-cell lines. BMC Mol Biol 11: 99 doi: 10.118/1471-2199-11-99 - PMC - PubMed
    1. Askarian-Amiri ME, Crawford J, French JD, Smart CE, Smith MA, Clark MB, Ru K, Mercer TR, Thompson ER, Lakhani SR, et al. 2011. SNORD-host RNA Zfas1 is a regulator of mammary development and a potential marker for breast cancer. RNA 17: 878–891 - PMC - PubMed

Publication types

MeSH terms

Associated data

LinkOut - more resources