. 2012 Dec;13(14):1396-406.
doi: 10.4161/cbt.22000. Epub 2012 Sep 6.

Characterization of the conversion between CD133+ and CD133- cells in colon cancer SW620 cell line

Affiliations

Characterization of the conversion between CD133+ and CD133- cells in colon cancer SW620 cell line

Jian-Ming Feng et al. Cancer Biol Ther. 2012 Dec.

Abstract

The state of cancer stem cells (CSC) under reversible fluctuations, which has been revealed in breast cancer cells most recently, suggests that subpopulations with distinct phenotypes and functions within cancer cells can undergo inter-conversion. To investigate the possibility in colon cancer cells, we employed CD133 as the CSC marker, and characterized CD133 expression pattern and the biological features of the CD133 (+) and CD133 (-) subsets. Flow cytometry revealed that CD133 was bimodally expressed in SW620 cells among eight colon cancer cell lines. The CD133 (+) clonal SW620 cells displayed a differential gene expression profile, higher cellular reactive oxygen species (ROS), enhanced tumorigenesis and resistance to 5-fluorouracil. The conversion in term of the CD133 phenotype of the sorted cells was observed in vitro and in vivo. The fraction of the CD133 (+) cells decreased from 99% to 80% in the sorted CD133 (+) population while rising from 5 to 10% in the sorted CD133 (-) population during the first 20-day cultivation and then stayed almost unchanged. A fraction (about 20%) of the CD133 (+) clonal cells lost their CD133 marker while about 10% of the CD133 (-) clonal cells acquired the CD133 marker. 5-Azacytidine enhanced the fraction of the CD133 (+) cells in both of the CD133 (+) and CD133 (-) clonal cells. Our data demonstrate that CD133 expression is dynamic and reversible, and reveal the inter-conversion between the CD133 (+) and the CD133 (-) SW620 cells, suggesting that the CD133 phenotype of SW620 cell population is retained by the conversion between the two cell subsets.


Figures

None
Figure 1. The expression of CD133 in eight human colon cancer cell lines. (A) The expression of CD133 was detected by flow cytometry in eight human colon cancer cell lines. The gray histograms represented the isotype control. The values were the percentage of the CD133+ cells in each cell line. (B) The CD133+ cells and the CD133- cells were sorted by magnetic cell sorting. The values evaluated by flow cytometry were the percentage of the CD133+ cells and the CD133- cells before and after being sorted. The results were representative of three independent experiments.
None
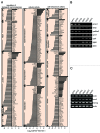
Figure 2. The differential gene expression profiles of the CD133+ SW620 cells and the CD133- counterparts. (A) Microarray analyses were performed to identify the differentially expressed genes in the purified CD133+ clonal SW620 cells and the purified CD133- counterparts. The results were expressed as the mean of two independent experiments. The genes with more than 2-fold change in their mRNA levels were listed and roughly classified according to their biological functions. (B) The mRNA levels of 6 genes in the microarray data were validated by RT-PCR in three CD133+ (CPC1, CPC2, CPC3) and three CD133- (CNC1, CNC2, CNC3) clonal cell populations. (C) The mRNA levels of the indicated genes were validated as in (B).
None
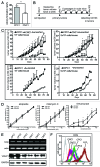
Figure 3. Tumorigenicity, drug sensitivity and cellular ROS levels of the CD133+ cells and the CD133- cells. (A) The differential colony-formation rate of the CD133+ clonal cells (CPC1) and the CD133- clonal cells (CNC1). The asterisks denoted statistical significance by the Student’s t test (p < 0.05). (B) The schedule for the in vivo tumor formation assays. At day 0, the clonal CD133- (CNC1) cells and CD133+ (CPC1) cells and the unsorted SW620 cells were subcutaneously injected into nude mice. In following 74 d, tumor volume was measured twice a week. At day 74, the mice bearing primary tumors were euthanized and the fresh tumors were transplanted into nude mice for sequential passages in vivo for 130 d and the 5th passage of xenografts were taken out for the detection of CD133. (C) Growth curves of the primary tumors generated from the CNC1 and CPC1 cells and the unsorted SW620 cells. The tumor volume was recorded up to 74 d post the cell injection and expressed as mean ± SD (n = 6) if applicable. The single values were from the groups with less than 3 xenografts formed or mice died of tumor burden (after 60 d post the cell injection). The differences between tumor volumes of CPC1 and those of CNC1 were analyzed by the Student’s t test and marked with asterisks if there was statistical significance (p < 0.05). Solid squares, CPC1 cells; solid triangles, CNC1 cells; blank circles, unsorted SW620 cells. (D) The growth inhibition of anti-tumor drugs on CD133+ and CD133- cells was evaluated by SRB assays and the results were statistically analyzed by the Student’s t test (asterisks, p < 0.05). (E) The mRNA (upper panel) and protein (lower panel) levels of VDUP1 were detected by RT-PCR and western blotting, respectively. (F) Intrtacellular ROS levels in the indicated clonal cells (CPC, CD133+; CNC, CD133-; number, different clones) were detected by flow cytometry. Grey, blank control (right panel). All the data were representative of three independent experiments.
None
Figure 4. Changes of the CD133 levels in sorted SW620 cells. (A) The proportion of the CD133+ cells and the CD133- cells was measured by flow cytometry in the SW620 cell line during 2-week cultivation (left panel) and the data were statistically analyzed as shown in right panel. (B) The levels of CD133 in the sorted SW620 cells were examined at the indicated time points during about 6-week cultivation after cell sorting. (C) The growth rate of the sorted populations was evaluated by cell counting (upper panel) and SRB assays (lower panel). Bars represent the standard deviation. The indicated proteins were tested by western blotting. (D) The expression of CK20, CD44, ESA and CD166 was examined by flow cytometry. (E) Comparison between the two sorted subpopulations in the cell size (FSC-H) and complexity of intracellular structure (SSC-H) by flow cytometry. (F) Assays for cell cycle progression (top) and mitochondria membrane potential (bottom) of the CD133+ cells and the CD133- cells by flow cytometry. All the data were representative of three independent experiments.
None
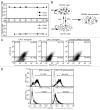
Figure 5. Cell populations derived from single CD133+ and CD133- SW620 cells developed differential phenotypic equilibrium in vitro and in vivo. (A) The levels of CD133 in the clonal cells established from the sorted SW620 cells were measured at the indicated time points during 160-d cultivation. Single cell suspension from the sorted CD133+ subpopulation and the CD133- counterpart was plated. After 16 h, the medium was changed and the positions of adherent single cells were marked. Two weeks later, 18 marked clones were randomly picked out, expanded for another 3 to 4 weeks and two of them were taken to examine the levels of CD133. CPC and CNC represent the clonal cells established from sorted CD133+ subpopulation and the CD133- counterpart, respectively. (B) The diagram illustrates the conversion between CD133+ and CD133- cells and the phenotypic equilibrium in SW620 cells. The values represent the proportion within the cell population. Grey cirle, CD133+ cells; blank circle, CD133- cells. (C) The cells from the 5th passaged xenografts (as described in Fig. 3B) were labeled with CD133/2-PE and ESA-FITC to examine the CD133 levels. The ESA+ cells represented SW620 cells while ESA- cells represented the cells from mice. The value in each quadrant was the proportion of the corresponding cells in the whole population. (D) The CD133+ clonal cells and the CD133- clonal cells were treated with 5-azacytidine (5-azaCR) for 48 h. The levels of CD133 were examined by flow cytometry. All the data were representative of three independent experiments.

Similar articles

Cited by

References

    1. Chaffer CL, Brueckmann I, Scheel C, Kaestli AJ, Wiggins PA, Rodrigues LO, et al. Normal and neoplastic nonstem cells can spontaneously convert to a stem-like state. Proc Natl Acad Sci U S A. 2011;108:7950–5. doi: 10.1073/pnas.1102454108. - DOI - PMC - PubMed
    1. Gupta PB, Fillmore CM, Jiang G, Shapira SD, Tao K, Kuperwasser C, et al. Stochastic state transitions give rise to phenotypic equilibrium in populations of cancer cells. Cell. 2011;146:633–44. doi: 10.1016/j.cell.2011.07.026. - DOI - PubMed
    1. Singh SK, Clarke ID, Terasaki M, Bonn VE, Hawkins C, Squire J, et al. Identification of a cancer stem cell in human brain tumors. Cancer Res. 2003;63:5821–8. - PubMed
    1. Hermann PC, Huber SL, Herrler T, Aicher A, Ellwart JW, Guba M, et al. Distinct populations of cancer stem cells determine tumor growth and metastatic activity in human pancreatic cancer. Cell Stem Cell. 2007;1:313–23. doi: 10.1016/j.stem.2007.06.002. - DOI - PubMed
    1. Eramo A, Lotti F, Sette G, Pilozzi E, Biffoni M, Di Virgilio A, et al. Identification and expansion of the tumorigenic lung cancer stem cell population. Cell Death Differ. 2008;15:504–14. doi: 10.1038/sj.cdd.4402283. - DOI - PubMed

Publication types

MeSH terms