

Itga2b regulation at the onset of definitive hematopoiesis and commitment to differentiation
- PMID: 22952660
- PMCID: PMC3429474
- DOI: 10.1371/journal.pone.0043300
Itga2b regulation at the onset of definitive hematopoiesis and commitment to differentiation
Abstract
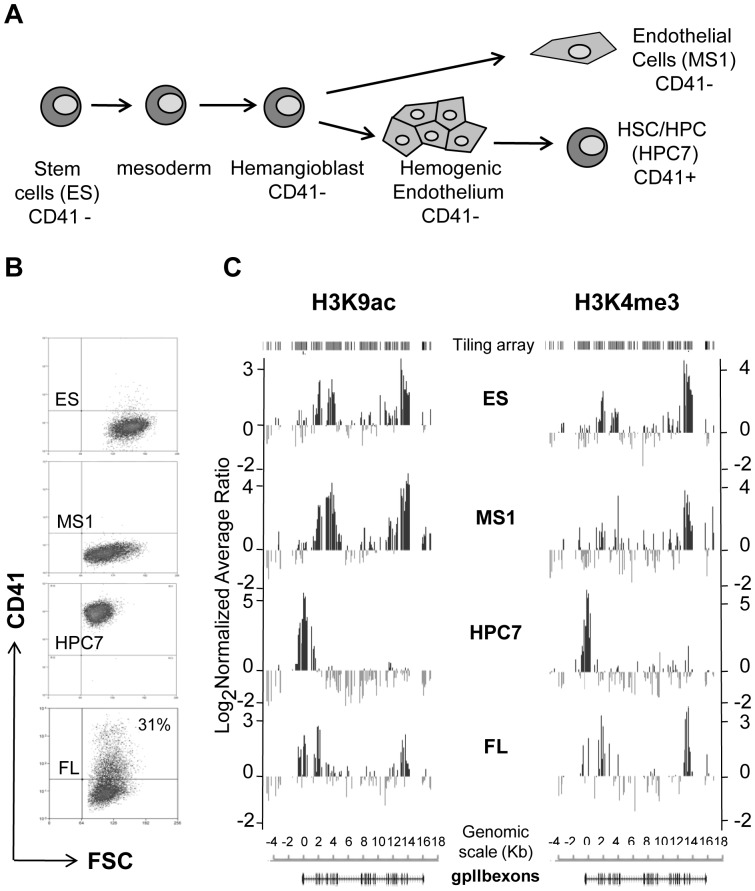
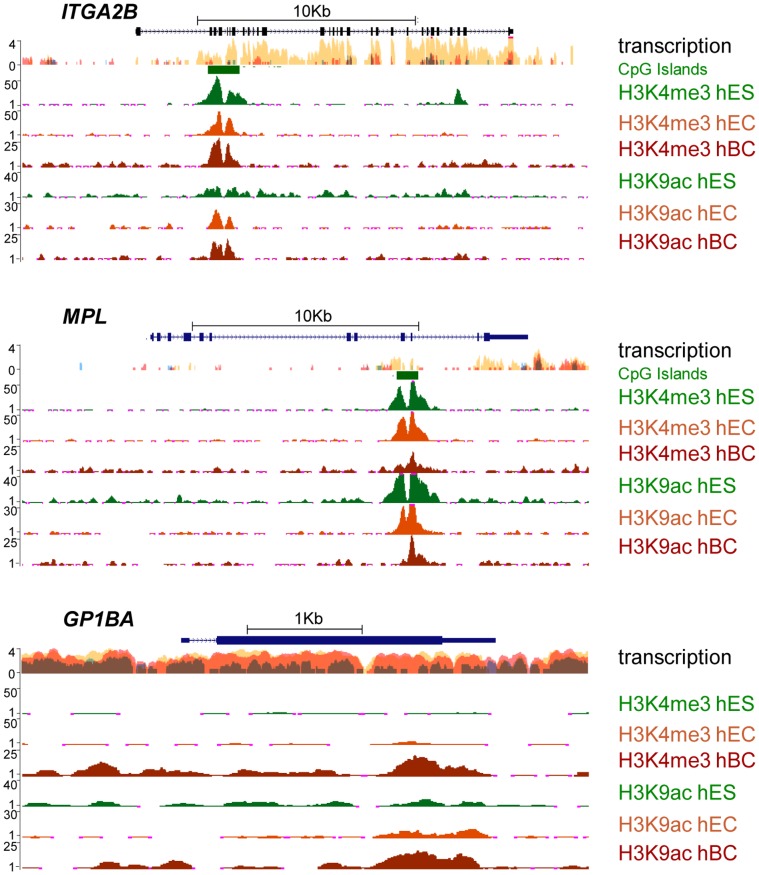
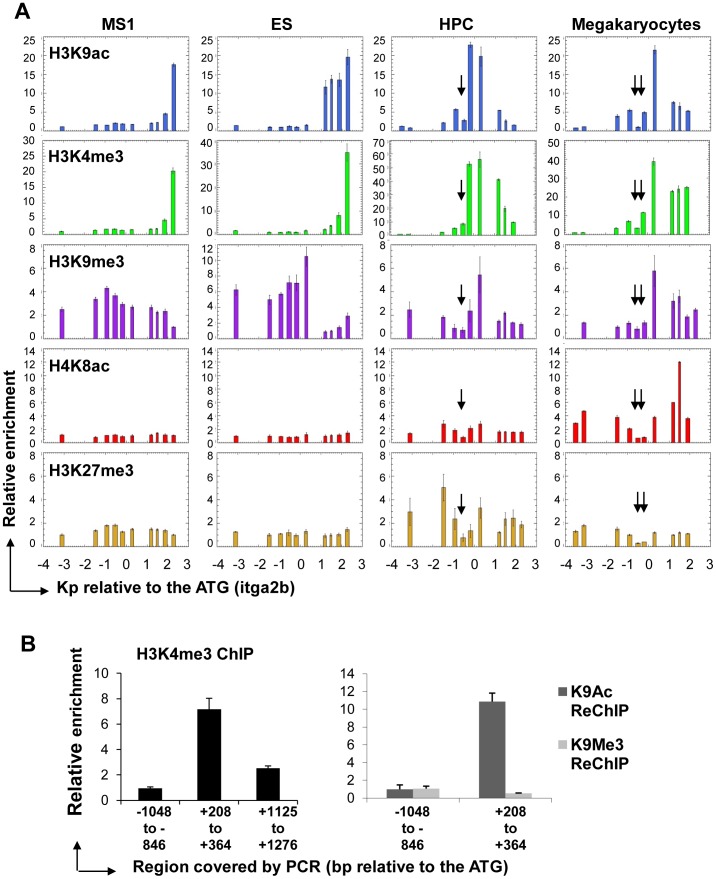
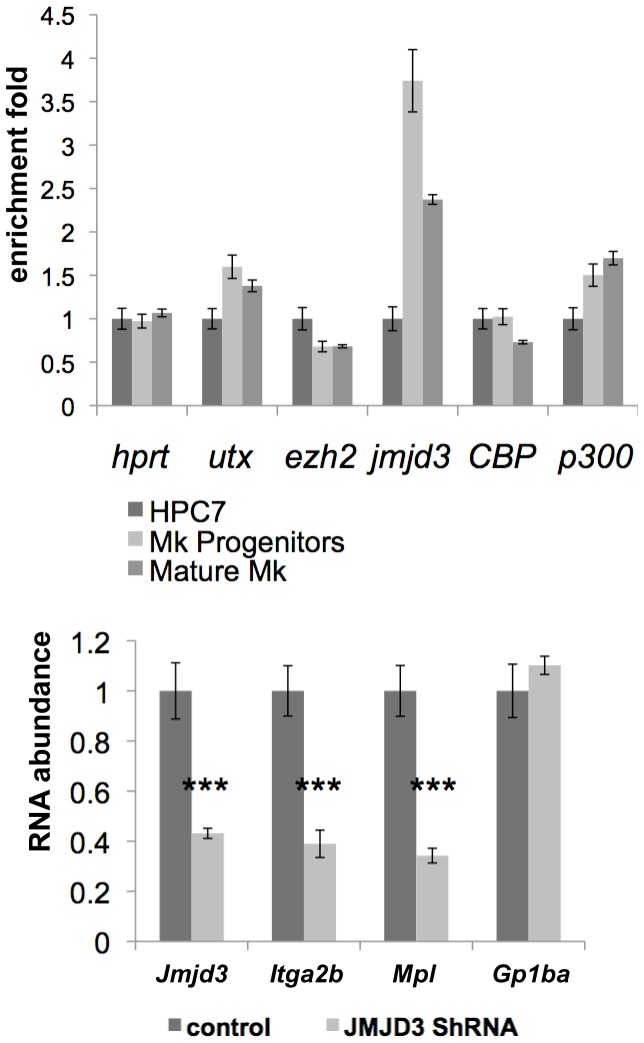
Product of the Itga2b gene, CD41 contributes to hematopoietic stem cell (HSC) and megakaryocyte/platelet functions. CD41 expression marks the onset of definitive hematopoiesis in the embryo where it participates in regulating the numbers of multipotential progenitors. Key to platelet aggregation, CD41 expression also characterises their precursor, the megakaryocyte, and is specifically up regulated during megakaryopoiesis. Though phenotypically unique, megakaryocytes and HSC share numerous features, including key transcription factors, which could indicate common sub-regulatory networks. In these respects, Itga2b can serve as a paradigm to study features of both developmental-stage and HSC- versus megakaryocyte-specific regulations. By comparing different cellular contexts, we highlight a mechanism by which internal promoters participate in Itga2b regulation. A developmental process connects epigenetic regulation and promoter switching leading to CD41 expression in HSC. Interestingly, a similar process can be observed at the Mpl locus, which codes for another receptor that defines both HSC and megakaryocyte identities. Our study shows that Itga2b expression is controlled by lineage-specific networks and associates with H4K8ac in megakaryocyte or H3K27me3 in the multipotential hematopoietic cell line HPC7. Correlating with the decrease in H3K27me3 at the Itga2b Iocus, we find that following commitment to megakaryocyte differentiation, the H3K27 demethylase Jmjd3 up-regulation influences both Itga2b and Mpl expression.
Conflict of interest statement
Figures


Similar articles
-
A common bipotent progenitor generates the erythroid and megakaryocyte lineages in embryonic stem cell-derived primitive hematopoiesis.Blood. 2009 Aug 20;114(8):1506-17. doi: 10.1182/blood-2008-09-178863. Epub 2009 May 28. Blood. 2009. PMID: 19478046
-
Expression of CD41 marks the initiation of definitive hematopoiesis in the mouse embryo.Blood. 2003 Jan 15;101(2):508-16. doi: 10.1182/blood-2002-06-1699. Epub 2002 Sep 19. Blood. 2003. PMID: 12393529
-
CD45 expression discriminates waves of embryonic megakaryocytes in the mouse.Haematologica. 2019 Sep;104(9):1853-1865. doi: 10.3324/haematol.2018.192559. Epub 2018 Dec 20. Haematologica. 2019. PMID: 30573502 Free PMC article.
-
Megakaryocyte development and platelet production.Br J Haematol. 2006 Sep;134(5):453-66. doi: 10.1111/j.1365-2141.2006.06215.x. Br J Haematol. 2006. PMID: 16856888 Review.
-
[Thrombopoietin and megakaryocyte differentiation].Schweiz Med Wochenschr. 1998 Oct 17;128(42):1575-81. Schweiz Med Wochenschr. 1998. PMID: 9824885 Review. French.
Cited by
-
DMAG, a novel countermeasure for the treatment of thrombocytopenia.Mol Med. 2021 Nov 27;27(1):149. doi: 10.1186/s10020-021-00404-1. Mol Med. 2021. PMID: 34837956 Free PMC article.
-
Regulation of the Flt3 Gene in Haematopoietic Stem and Early Progenitor Cells.PLoS One. 2015 Sep 18;10(9):e0138257. doi: 10.1371/journal.pone.0138257. eCollection 2015. PLoS One. 2015. PMID: 26382271 Free PMC article.
-
Inefficient megakaryopoiesis in mouse hematopoietic stem-progenitor cells lacking T-bet.Exp Hematol. 2016 Mar;44(3):194-206.e17. doi: 10.1016/j.exphem.2015.11.003. Epub 2015 Nov 19. Exp Hematol. 2016. PMID: 26607595 Free PMC article.
-
Cytokine-induced megakaryocytic differentiation is regulated by genome-wide loss of a uSTAT transcriptional program.EMBO J. 2016 Mar 15;35(6):580-94. doi: 10.15252/embj.201592383. Epub 2015 Dec 23. EMBO J. 2016. PMID: 26702099 Free PMC article.
-
Transcriptional regulation of SPROUTY2 by MYB influences myeloid cell proliferation and stem cell properties by enhancing responsiveness to IL-3.Leukemia. 2017 Apr;31(4):957-966. doi: 10.1038/leu.2016.289. Epub 2016 Oct 17. Leukemia. 2017. PMID: 27748374 Free PMC article.
References
-
- Shogren-Knaak M, Ishii H, Sun JM, Pazin MJ, Davie JR, et al. (2006) Histone H4-K16 acetylation controls chromatin structure and protein interactions. Science 311: 844–847. - PubMed
-
- Sims RJ 3rd, Nishioka K, Reinberg D (2003) Histone lysine methylation: a signature for chromatin function. Trends Genet 19: 629–639. - PubMed
-
- Bannister AJ, Kouzarides T (2005) Reversing histone methylation. Nature 436: 1103–1106. - PubMed
-
- Bernstein BE, Mikkelsen TS, Xie X, Kamal M, Huebert DJ, et al. (2006) A bivalent chromatin structure marks key developmental genes in embryonic stem cells. Cell 125: 315–326. - PubMed
Publication types
MeSH terms
Substances
Grants and funding
- 08433/Z/07/Z/WT_/Wellcome Trust/United Kingdom
- MC_PC_12009/MRC_/Medical Research Council/United Kingdom
- 079249/WT_/Wellcome Trust/United Kingdom
- G0900729/1/NC3RS_/National Centre for the Replacement, Refinement and Reduction of Animals in Research/United Kingdom
- 12765/CRUK_/Cancer Research UK/United Kingdom
LinkOut - more resources
Full Text Sources
