

A novel MCPH1 isoform complements the defective chromosome condensation of human MCPH1-deficient cells
- PMID: 22952573
- PMCID: PMC3431399
- DOI: 10.1371/journal.pone.0040387
A novel MCPH1 isoform complements the defective chromosome condensation of human MCPH1-deficient cells
Abstract
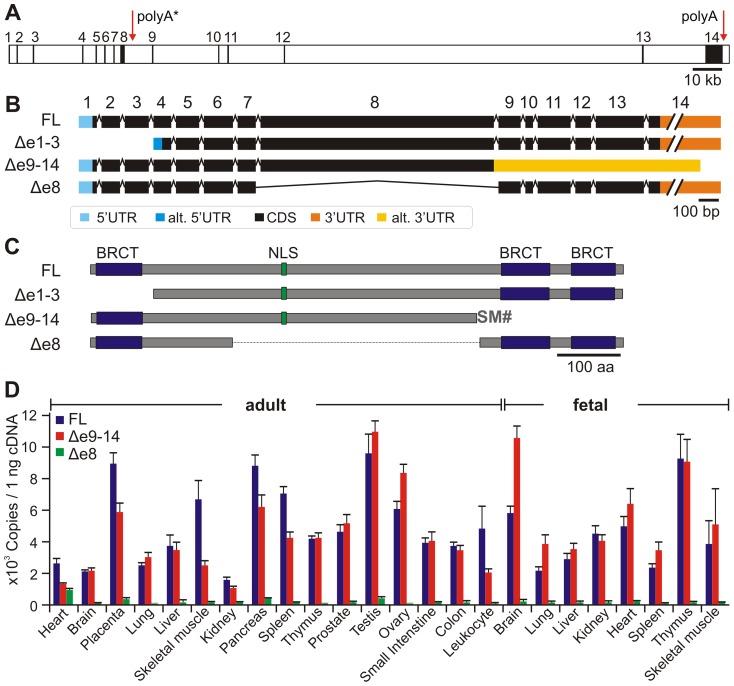
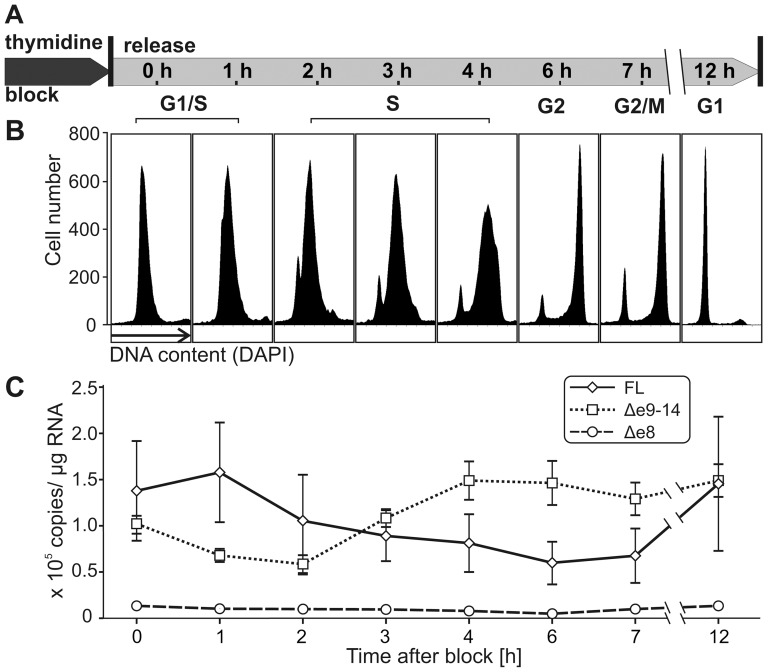
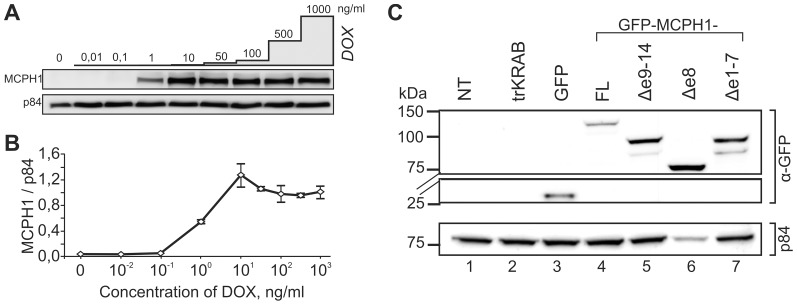
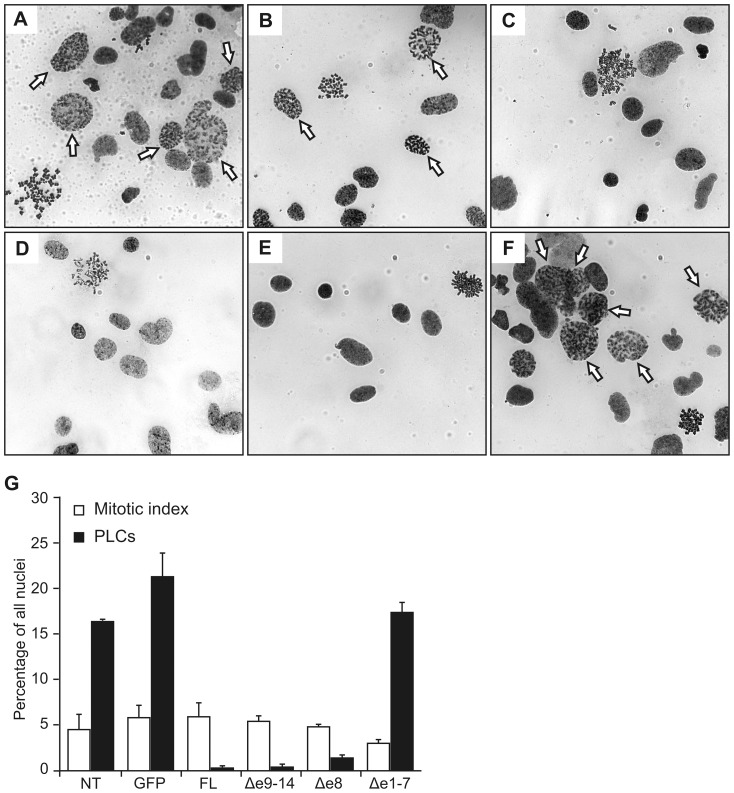
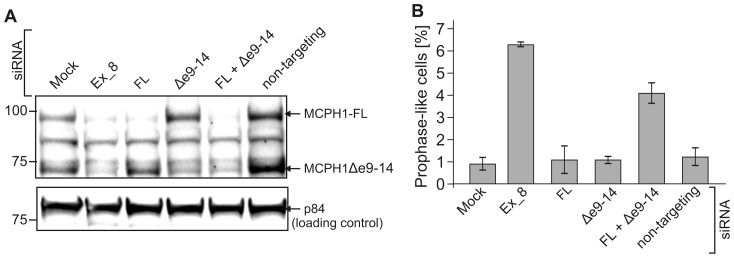
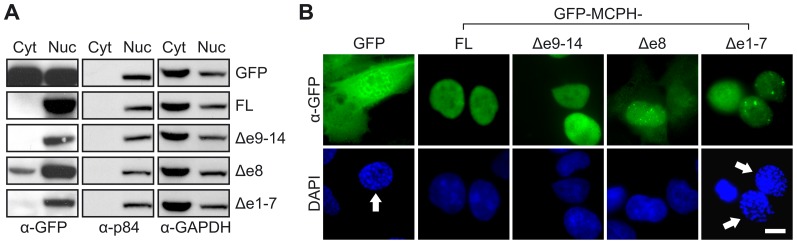
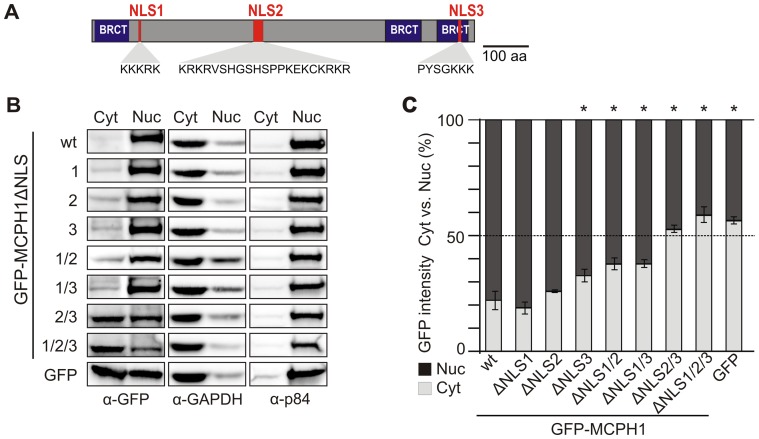
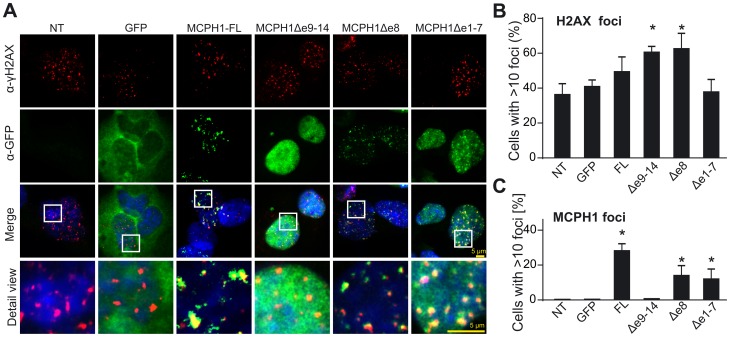
Biallelic mutations in MCPH1 cause primary microcephaly (MCPH) with the cellular phenotype of defective chromosome condensation. MCPH1 encodes a multifunctional protein that notably is involved in brain development, regulation of chromosome condensation, and DNA damage response. In the present studies, we detected that MCPH1 encodes several distinct transcripts, including two major forms: full-length MCPH1 (MCPH1-FL) and a second transcript lacking the six 3' exons (MCPH1Δe9-14). Both variants show comparable tissue-specific expression patterns, demonstrate nuclear localization that is mediated independently via separate NLS motifs, and are more abundant in certain fetal than adult organs. In addition, the expression of either isoform complements the chromosome condensation defect found in genetically MCPH1-deficient or MCPH1 siRNA-depleted cells, demonstrating a redundancy of both MCPH1 isoforms for the regulation of chromosome condensation. Strikingly however, both transcripts are regulated antagonistically during cell-cycle progression and there are functional differences between the isoforms with regard to the DNA damage response; MCPH1-FL localizes to phosphorylated H2AX repair foci following ionizing irradiation, while MCPH1Δe9-14 was evenly distributed in the nucleus. In summary, our results demonstrate here that MCPH1 encodes different isoforms that are differentially regulated at the transcript level and have different functions at the protein level.
Conflict of interest statement
Figures
Similar articles
-
MCPH1 patient cells exhibit delayed release from DNA damage-induced G2/M checkpoint arrest.Cell Cycle. 2010 Dec 15;9(24):4893-9. doi: 10.4161/cc.9.24.14157. Epub 2010 Dec 15. Cell Cycle. 2010. PMID: 21150325 Free PMC article.
-
SET nuclear oncogene associates with microcephalin/MCPH1 and regulates chromosome condensation.J Biol Chem. 2011 Jun 17;286(24):21393-400. doi: 10.1074/jbc.M110.208793. Epub 2011 Apr 22. J Biol Chem. 2011. PMID: 21515671 Free PMC article.
-
Establishment of a mouse model with misregulated chromosome condensation due to defective Mcph1 function.PLoS One. 2010 Feb 16;5(2):e9242. doi: 10.1371/journal.pone.0009242. PLoS One. 2010. PMID: 20169082 Free PMC article.
-
Microcephalin: a causal link between impaired damage response signalling and microcephaly.Cell Cycle. 2006 Oct;5(20):2339-44. doi: 10.4161/cc.5.20.3358. Epub 2006 Oct 16. Cell Cycle. 2006. PMID: 17102619 Review.
-
The DNA damage response molecule MCPH1 in brain development and beyond.Acta Biochim Biophys Sin (Shanghai). 2016 Jul;48(7):678-85. doi: 10.1093/abbs/gmw048. Epub 2016 May 19. Acta Biochim Biophys Sin (Shanghai). 2016. PMID: 27197793 Review.
Cited by
-
Phosphorylation of MCPH1 isoforms during mitosis followed by isoform-specific degradation by APC/C-CDH1.FASEB J. 2019 Feb;33(2):2796-2808. doi: 10.1096/fj.201801353R. Epub 2018 Oct 10. FASEB J. 2019. PMID: 30303738 Free PMC article.
-
Transgelin induces dysfunction of fetal endothelial colony-forming cells from gestational diabetic pregnancies.Am J Physiol Cell Physiol. 2018 Oct 1;315(4):C502-C515. doi: 10.1152/ajpcell.00137.2018. Epub 2018 Jun 27. Am J Physiol Cell Physiol. 2018. PMID: 29949406 Free PMC article.
-
The emerging role of MCPH1/BRIT1 in carcinogenesis.Front Oncol. 2023 Jan 31;13:1047588. doi: 10.3389/fonc.2023.1047588. eCollection 2023. Front Oncol. 2023. PMID: 36845691 Free PMC article. Review.
-
The E3 ubiquitin ligase APC/CCdh1 degrades MCPH1 after MCPH1-βTrCP2-Cdc25A-mediated mitotic entry to ensure neurogenesis.EMBO J. 2017 Dec 15;36(24):3666-3681. doi: 10.15252/embj.201694443. Epub 2017 Nov 17. EMBO J. 2017. PMID: 29150431 Free PMC article.
-
MCPH1, mutated in primary microcephaly, is required for efficient chromosome alignment during mitosis.Sci Rep. 2017 Oct 12;7(1):13019. doi: 10.1038/s41598-017-12793-7. Sci Rep. 2017. PMID: 29026105 Free PMC article.
References
-
- Cox J, Jackson AP, Bond J, Woods CG (2006) What primary microcephaly can tell us about brain growth. Trends Mol Med 12 (8) 358–366. - PubMed
-
- Desir J, Cassart M, David P, van Bogaert P, Abramowicz M (2008) Primary microcephaly with ASPM mutation shows simplified cortical gyration with antero-posterior gradient pre- and post-natally. Am J Med Genet A 146 (11) 1439–1443. - PubMed
-
- Roberts E, Jackson AP, Carradice AC, Deeble VJ, Mannan J, et al. (1999) The second locus for autosomal recessive primary microcephaly (MCPH2) maps to chromosome 19q13.1–13.2. Eur J Hum Genet 7 (7) 815–820. - PubMed
Publication types
MeSH terms
Substances
Grants and funding
LinkOut - more resources
Full Text Sources
Molecular Biology Databases
