

Uncovering transcription factor modules using one- and three-dimensional analyses
- PMID: 22952238
- PMCID: PMC3438924
- DOI: 10.1074/jbc.R111.309229
Uncovering transcription factor modules using one- and three-dimensional analyses
Abstract
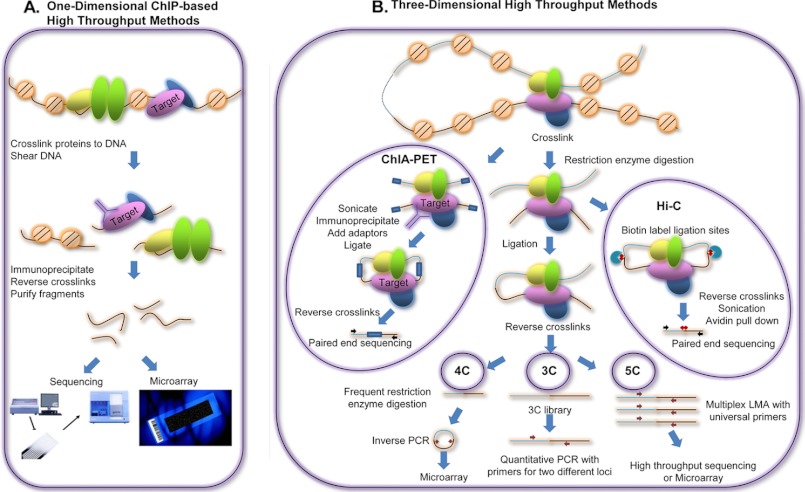
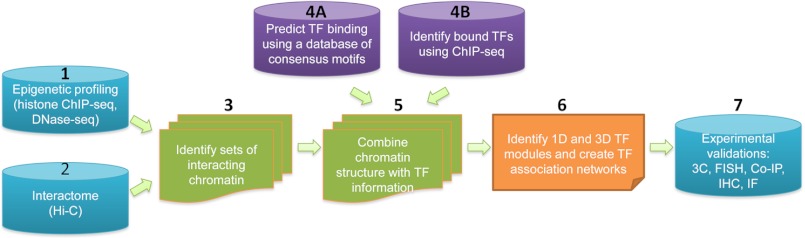
Transcriptional regulation is a critical mediator of many normal cellular processes, as well as disease progression. Transcription factors (TFs) often co-localize at cis-regulatory elements on the DNA, form protein complexes, and collaboratively regulate gene expression. Machine learning and Bayesian approaches have been used to identify TF modules in a one-dimensional context. However, recent studies using high throughput technologies have shown that TF interactions should also be considered in three-dimensional nuclear space. Here, we describe methods for identifying TF modules and discuss how moving from a one-dimensional to a three-dimensional paradigm, along with integrated experimental and computational approaches, can lead to a better understanding of TF association networks.
Figures
Similar articles
-
Inter- and intra-combinatorial regulation by transcription factors and microRNAs.BMC Genomics. 2007 Oct 30;8:396. doi: 10.1186/1471-2164-8-396. BMC Genomics. 2007. PMID: 17971223 Free PMC article.
-
Improved recovery of cell-cycle gene expression in Saccharomyces cerevisiae from regulatory interactions in multiple omics data.BMC Genomics. 2020 Feb 13;21(1):159. doi: 10.1186/s12864-020-6554-8. BMC Genomics. 2020. PMID: 32054475 Free PMC article.
-
Network motif-based identification of transcription factor-target gene relationships by integrating multi-source biological data.BMC Bioinformatics. 2008 Apr 21;9:203. doi: 10.1186/1471-2105-9-203. BMC Bioinformatics. 2008. PMID: 18426580 Free PMC article.
-
Inferring transcriptional interactions and regulator activities from experimental data.Mol Cells. 2007 Dec 31;24(3):307-15. Mol Cells. 2007. PMID: 18182844 Review.
-
Organizing combinatorial transcription factor recruitment at cis-regulatory modules.Transcription. 2018;9(4):233-239. doi: 10.1080/21541264.2017.1394424. Epub 2017 Nov 28. Transcription. 2018. PMID: 29105538 Free PMC article. Review.
Cited by
-
Understanding spatial organizations of chromosomes via statistical analysis of Hi-C data.Quant Biol. 2013 Jun;1(2):156-174. doi: 10.1007/s40484-013-0016-0. Quant Biol. 2013. PMID: 26124977 Free PMC article.
-
Insights into neural crest development and evolution from genomic analysis.Genome Res. 2013 Jul;23(7):1069-80. doi: 10.1101/gr.157586.113. Genome Res. 2013. PMID: 23817048 Free PMC article. Review.
-
Regulatory SNPs: Altered Transcription Factor Binding Sites Implicated in Complex Traits and Diseases.Int J Mol Sci. 2021 Jun 16;22(12):6454. doi: 10.3390/ijms22126454. Int J Mol Sci. 2021. PMID: 34208629 Free PMC article. Review.
-
Demystifying the secret mission of enhancers: linking distal regulatory elements to target genes.Crit Rev Biochem Mol Biol. 2015;50(6):550-73. doi: 10.3109/10409238.2015.1087961. Epub 2015 Oct 8. Crit Rev Biochem Mol Biol. 2015. PMID: 26446758 Free PMC article. Review.
-
Three-dimensional analysis reveals altered chromatin interaction by enhancer inhibitors harbors TCF7L2-regulated cancer gene signature.J Cell Biochem. 2019 Mar;120(3):3056-3070. doi: 10.1002/jcb.27449. Epub 2018 Dec 11. J Cell Biochem. 2019. PMID: 30548288 Free PMC article.
References
-
- Vaquerizas J. M., Kummerfeld S. K., Teichmann S. A., Luscombe N. M. (2009) A census of human transcription factors: function, expression, and evolution. Nat. Rev. Genet. 10, 252–263 - PubMed
-
- Panne D. (2008) The enhanceosome. Curr. Opin. Struct. Biol. 18, 236–242 - PubMed
-
- Maniatis T., Falvo J. V., Kim T. H., Kim T. K., Lin C. H., Parekh B. S., Wathelet M. G. (1998) Structure and function of the interferon-β enhanceosome. Cold Spring Harb. Symp. Quant. Biol. 63, 609–620 - PubMed
-
- Howard M. L., Davidson E. H. (2004) cis-Regulatory control circuits in development. Dev. Biol. 271, 109–118 - PubMed
-
- Göndör A., Ohlsson R. (2009) Chromosome cross-talk in three dimensions. Nature 461, 212–217 - PubMed
Publication types
MeSH terms
Substances
Grants and funding
LinkOut - more resources
Full Text Sources
Miscellaneous
