Direct substitution and assisted dissociation pathways for turning off transcription by a MerR-family metalloregulator
- PMID: 22949686
- PMCID: PMC3458356
- DOI: 10.1073/pnas.1208508109
Direct substitution and assisted dissociation pathways for turning off transcription by a MerR-family metalloregulator
Abstract
Metalloregulators regulate transcription in response to metal ions. Many studies have provided insights into how transcription is activated upon metal binding by MerR-family metalloregulators. In contrast, how transcription is turned off after activation is unclear. Turning off transcription promptly is important, however, as the cells would not want to continue expressing metal resistance genes and thus waste energy after metal stress is relieved. Using single-molecule FRET measurements we studied the dynamic interactions of the copper efflux regulator (CueR), a Cu(+)-responsive MerR-family metalloregulator, with DNA. Besides quantifying its DNA binding and unbinding kinetics, we discovered that CueR spontaneously flips its binding orientation at the recognition site. CueR also has two different binding modes, corresponding to interactions with specific and nonspecific DNA sequences, which would facilitate recognition localization. Most strikingly, a CueR molecule coming from solution can directly substitute for a DNA-bound CueR or assist the dissociation of the incumbent CueR, both of which are unique examples for any DNA-binding protein. The kinetics of the direct protein substitution and assisted dissociation reactions indicate that these two unique processes can provide efficient pathways to replace a DNA-bound holo-CueR with apo-CueR, thus turning off transcription promptly and facilely.
Conflict of interest statement
The authors declare no conflict of interest.
Figures


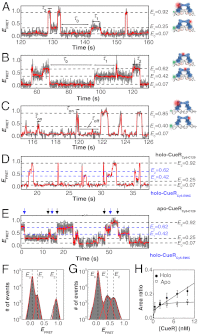
 for CueRCy5-C129–DNA interactions. Solid lines are fits with Eq. 5 (see also

 for CueRCy5-C129–DNA interactions. Solid lines are fits with Eqs. 6 (holo) and 7 (apo). (B) The [holo-CueR] dependence of
  for holo-CueRCy5-C129 interactions with the nonspecific DNA; the τ1 and τ2 are combined here and denoted as τon. Solid line is a fit with a horizontal line at 5.9 ± 0.1 s-1. Each data point in A and B is an average of data from about 250 EFRET trajectories. (C) Dependence of N2→1/N2→0 on [holo-CueRCy5-C129]. Solid line is a fit with Eq. 3. (D) Dependence of N2→1/N2→0 on [apo-CueRCy5-C129]. Solid line is a fit with Eq. 4. (Inset) Same data but the y-value is the inverse, N2→0/N2→1.

Similar articles
-
Metalloregulator CueR biases RNA polymerase's kinetic sampling of dead-end or open complex to repress or activate transcription.Proc Natl Acad Sci U S A. 2015 Nov 3;112(44):13467-72. doi: 10.1073/pnas.1515231112. Epub 2015 Oct 19. Proc Natl Acad Sci U S A. 2015. PMID: 26483469 Free PMC article.
-
Structural and Dynamics Characterization of the MerR Family Metalloregulator CueR in its Repression and Activation States.Structure. 2017 Jul 5;25(7):988-996.e3. doi: 10.1016/j.str.2017.05.004. Epub 2017 Jun 1. Structure. 2017. PMID: 28578875
-
Single-molecule study of metalloregulator CueR-DNA interactions using engineered Holliday junctions.Biophys J. 2009 Aug 5;97(3):844-52. doi: 10.1016/j.bpj.2009.05.027. Biophys J. 2009. PMID: 19651042 Free PMC article.
-
The Copper Efflux Regulator (CueR).Subcell Biochem. 2024;104:17-31. doi: 10.1007/978-3-031-58843-3_2. Subcell Biochem. 2024. PMID: 38963481 Review.
-
Facilitated Unbinding via Multivalency-Enabled Ternary Complexes: New Paradigm for Protein-DNA Interactions.Acc Chem Res. 2018 Apr 17;51(4):860-868. doi: 10.1021/acs.accounts.7b00541. Epub 2018 Jan 25. Acc Chem Res. 2018. PMID: 29368512 Free PMC article. Review.
Cited by
-
EPR Spectroscopy Provides New Insights into Complex Biological Reaction Mechanisms.J Phys Chem B. 2022 Oct 6;126(39):7486-7494. doi: 10.1021/acs.jpcb.2c05235. Epub 2022 Sep 22. J Phys Chem B. 2022. PMID: 36137278 Free PMC article. Review.
-
Static Kinks or Flexible Hinges: Multiple Conformations of Bent DNA Bound to Integration Host Factor Revealed by Fluorescence Lifetime Measurements.J Phys Chem B. 2018 Dec 13;122(49):11519-11534. doi: 10.1021/acs.jpcb.8b07405. Epub 2018 Nov 7. J Phys Chem B. 2018. PMID: 30336035 Free PMC article.
-
Unraveling the Impact of Cysteine-to-Serine Mutations on the Structural and Functional Properties of Cu(I)-Binding Proteins.Int J Mol Sci. 2019 Jul 14;20(14):3462. doi: 10.3390/ijms20143462. Int J Mol Sci. 2019. PMID: 31337158 Free PMC article.
-
Multiple-binding-site mechanism explains concentration-dependent unbinding rates of DNA-binding proteins.Nucleic Acids Res. 2014 Apr;42(6):3783-91. doi: 10.1093/nar/gkt1327. Epub 2014 Jan 6. Nucleic Acids Res. 2014. PMID: 24393773 Free PMC article.
-
The Copper Efflux Regulator CueR Is Subject to ATP-Dependent Proteolysis in Escherichia coli.Front Mol Biosci. 2017 Feb 28;4:9. doi: 10.3389/fmolb.2017.00009. eCollection 2017. Front Mol Biosci. 2017. PMID: 28293558 Free PMC article.
References
-
- Finney LA, O’Halloran TV. Transition metal speciation in the cell: Insights from the chemistry of metal ion receptors. Science. 2003;300:931–936. - PubMed
-
- Andrews SC, Robinson AK, Rodriguez-Quinones F. Bacterial iron homeostasis. FEMS Microbiol Rev. 2003;27:215–237. - PubMed
-
- Waldron KJ, Rutherford JC, Ford D, Robinson NJ. Metalloproteins and metal sensing. Nature. 2009;460:823–830. - PubMed
-
- Moore CM, Helmann JD. Metal ion homeostasis in Bacillus subtillis. Curr Opin Microbiol. 2005;8:188–195. - PubMed
-
- Brown NL, Stoyanov JV, Kidd SP, Hobman JL. The MerR family of transcripitional regulators. FEMS Microbiol Rev. 2003;27:145–163. - PubMed
Publication types
MeSH terms
Substances
Grants and funding
LinkOut - more resources
Full Text Sources

