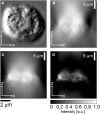
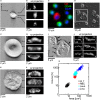
Quantification of cellular volume and sub-cellular density fluctuations: comparison of normal peripheral blood cells and circulating tumor cells identified in a breast cancer patient
- PMID: 22934287
- PMCID: PMC3414893
- DOI: 10.3389/fonc.2012.00096
Quantification of cellular volume and sub-cellular density fluctuations: comparison of normal peripheral blood cells and circulating tumor cells identified in a breast cancer patient
Abstract
Cancer metastasis, the leading cause of cancer-related deaths, is facilitated in part by the hematogenous transport of circulating tumor cells (CTCs) through the vasculature. Clinical studies have demonstrated that CTCs circulate in the blood of patients with metastatic disease across the major types of carcinomas, and that the number of CTCs in peripheral blood is correlated with overall survival in metastatic breast, colorectal, and prostate cancer. While the potential to monitor metastasis through CTC enumeration exists, the basic physical features of CTCs remain ill defined and moreover, the corresponding clinical utility of these physical parameters is unknown. To elucidate the basic physical features of CTCs we present a label-free imaging technique utilizing differential interference contrast (DIC) microscopy to measure cell volume and to quantify sub-cellular mass-density variations as well as the size of subcellular constituents from mass-density spatial correlations. DIC measurements were carried out on CTCs identified in a breast cancer patient using the high-definition (HD) CTC detection assay. We compared the biophysical features of HD-CTC to normal blood cell subpopulations including leukocytes, platelets (PLT), and red blood cells (RBCs). HD-CTCs were found to possess larger volumes, decreased mass-density fluctuations, and shorter-range spatial density correlations in comparison to leukocytes. Our results suggest that HD-CTCs exhibit biophysical signatures that might be used to potentially aid in their detection and to monitor responses to treatment in a label-free fashion. The biophysical parameters reported here can be incorporated into computational models of CTC-vascular interactions and in vitro flow models to better understand metastasis.
Keywords: breast cancer; cellular density; cellular volume; circulating tumor cells; differential interference contrast microscopy.
Figures


Similar articles
-
Prognostic impact of circulating tumor cell apoptosis and clusters in serial blood samples from patients with metastatic breast cancer in a prospective observational cohort.BMC Cancer. 2016 Jul 8;16:433. doi: 10.1186/s12885-016-2406-y. BMC Cancer. 2016. PMID: 27390845 Free PMC article.
-
Optical quantification of cellular mass, volume, and density of circulating tumor cells identified in an ovarian cancer patient.Front Oncol. 2012 Jul 18;2:72. doi: 10.3389/fonc.2012.00072. eCollection 2012. Front Oncol. 2012. PMID: 22826822 Free PMC article.
-
mRNA expression profiles in circulating tumor cells of metastatic colorectal cancer patients.Mol Oncol. 2015 Apr;9(4):920-32. doi: 10.1016/j.molonc.2015.01.001. Epub 2015 Jan 21. Mol Oncol. 2015. PMID: 25655581 Free PMC article.
-
Relevance of CTC Clusters in Breast Cancer Metastasis.Adv Exp Med Biol. 2020;1220:93-115. doi: 10.1007/978-3-030-35805-1_7. Adv Exp Med Biol. 2020. PMID: 32304082 Review.
-
New advances in circulating tumor cell‑mediated metastasis of breast cancer (Review).Mol Clin Oncol. 2023 Jul 24;19(3):71. doi: 10.3892/mco.2023.2667. eCollection 2023 Sep. Mol Clin Oncol. 2023. PMID: 37614367 Free PMC article. Review.
Cited by
-
Rolling in the deep: therapeutic targeting of circulating tumor cells.Front Oncol. 2012 Nov 29;2:184. doi: 10.3389/fonc.2012.00184. eCollection 2012. Front Oncol. 2012. PMID: 23226682 Free PMC article. No abstract available.
-
Prognostic impact of circulating tumor cell apoptosis and clusters in serial blood samples from patients with metastatic breast cancer in a prospective observational cohort.BMC Cancer. 2016 Jul 8;16:433. doi: 10.1186/s12885-016-2406-y. BMC Cancer. 2016. PMID: 27390845 Free PMC article.
-
Network signatures of nuclear and cytoplasmic density alterations in a model of pre and postmetastatic colorectal cancer.J Biomed Opt. 2014 Jan;19(1):16016. doi: 10.1117/1.JBO.19.1.016016. J Biomed Opt. 2014. PMID: 24441943 Free PMC article.
-
Development of a Label-free Imaging Technique for the Quantification of Thrombus Formation.Cell Mol Bioeng. 2012 Dec;5(4):488-492. doi: 10.1007/s12195-012-0249-4. Cell Mol Bioeng. 2012. PMID: 23585817 Free PMC article.
-
Liquid Biopsy as a Tool Exploring in Real-Time Both Genomic Perturbation and Resistance to EGFR Antagonists in Colorectal Cancer.Front Oncol. 2020 Sep 25;10:581130. doi: 10.3389/fonc.2020.581130. eCollection 2020. Front Oncol. 2020. PMID: 33102237 Free PMC article. Review.
References
-
- Allard W. J., Mater J., Miller M. C., Repollet M., Connelly M. C., Rao C., Tibbe A. G. J., Uhr J. W., Terstappen L. W. M. M. (2004). Tumor cells circulate in the peripheral blood of all major carcinomas but not in healthy subjects or patients with nonmalignant diseases. Clin. Cancer Res. 10, 6897–6904 10.1158/1078-0432.CCR-04-0378 - DOI - PubMed
-
- Barer R. (1952). Interference microscopy and mass determination. Nature 169, 366–367 - PubMed
-
- Cohen S. J., Punt C. J. A., Iannotti N., Saidman B. H., Sabbath K. D., Gabrail N. Y., Picus J., Morse M., Mitchell E., Miller M. C., Doyle G. V., Tissing H., Terstappen L. W. M. M., Meropol N. J. (2008). Relationship of circulating tumor cells to tumor response, progression-free survival, and overall survival in patients with metastatic colorectal cancer. JCO 26, 3213–3221 10.1200/JCO.2007.15.8923 - DOI - PubMed
Grants and funding
LinkOut - more resources
Full Text Sources
Other Literature Sources

