The protooncogene Vav1 regulates murine leukemia virus-induced T-cell leukemogenesis
- PMID: 22934252
- PMCID: PMC3429564
- DOI: 10.4161/onci.20225
The protooncogene Vav1 regulates murine leukemia virus-induced T-cell leukemogenesis
Abstract
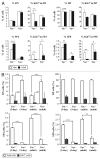
Vav1 is expressed exclusively in hematopoietic cells and is required for T cell development and activation. Vav1-deficient mice show thymic hypocellularity due to a partial block during thymocyte development at the DN3 stage and between the double positive (DP) and single positive (SP) transition. Vav1 has been shown to play a significant role in several non-hematopoietic tumors but its role in leukemogenesis is unknown. To address this question, we investigated the role of Vav1 in retrovirus-induced T cell leukemogenesis. Infection of Vav1-deficient mice with the Moloney strain of murine leukemia virus (M-MuLV) significantly affected tumor phenotype without modulating tumor incidence or latency. M-MuLV-infected Vav1-deficient mice showed reduced splenomegaly, higher hematocrit levels and hypertrophic thymi. Notably, Vav1-deficient mice with M-MuLV leukemias presented with markedly lower TCRβ/CD3 levels, indicating that transformation occurred at an earlier stage of T cell development than in WT mice. Thus, impaired T cell development modulates the outcome of retrovirus-induced T cell leukemias, demonstrating a link between T cell development and T cell leukemogenesis.
Figures


Similar articles
-
Moloney murine leukemia virus-induced preleukemic thymic atrophy and enhanced thymocyte apoptosis correlate with disease pathogenicity.J Virol. 1999 Mar;73(3):2434-41. doi: 10.1128/JVI.73.3.2434-2441.1999. J Virol. 1999. PMID: 9971828 Free PMC article.
-
Moloney murine leukemia virus-induced tumors show altered levels of proapoptotic and antiapoptotic proteins.J Virol. 2000 Sep;74(17):8151-8. doi: 10.1128/jvi.74.17.8151-8158.2000. J Virol. 2000. PMID: 10933726 Free PMC article.
-
Phenotyping of Evi1, Evi11/Cb2, and Evi12 transformed leukemias isolated from a novel panel of cas-Br-M murine leukemia virus-infected mice.Virology. 2000 Mar 15;268(2):308-18. doi: 10.1006/viro.2000.0183. Virology. 2000. PMID: 10704339
-
Introduction of a cis-acting mutation in the capsid-coding gene of moloney murine leukemia virus extends its leukemogenic properties.J Virol. 1999 Dec;73(12):10472-9. doi: 10.1128/JVI.73.12.10472-10479.1999. J Virol. 1999. PMID: 10559365 Free PMC article.
-
A multistep process of leukemogenesis in Moloney murine leukemia virus-infected mice that is modulated by retroviral pseudotyping and interference.J Virol. 1996 Jun;70(6):3852-62. doi: 10.1128/JVI.70.6.3852-3862.1996. J Virol. 1996. PMID: 8648721 Free PMC article.
Cited by
-
Chemical metabolic inhibitors for the treatment of blood-borne cancers.Anticancer Agents Med Chem. 2014 Feb;14(2):223-32. doi: 10.2174/18715206113136660374. Anticancer Agents Med Chem. 2014. PMID: 24237221 Free PMC article. Review.
-
Identification of Anti-tumor Cells Carrying Natural Killer (NK) Cell Antigens in Patients With Hematological Cancers.EBioMedicine. 2015 Aug 13;2(10):1364-76. doi: 10.1016/j.ebiom.2015.08.021. eCollection 2015 Oct. EBioMedicine. 2015. PMID: 26629531 Free PMC article.
References
Publication types
LinkOut - more resources
Full Text Sources
Molecular Biology Databases
Miscellaneous
