. 2012:8:605.
doi: 10.1038/msb.2012.37.

Inferring transcriptional and microRNA-mediated regulatory programs in glioblastoma

Affiliations

Inferring transcriptional and microRNA-mediated regulatory programs in glioblastoma

Manu Setty et al. Mol Syst Biol. 2012.

Abstract

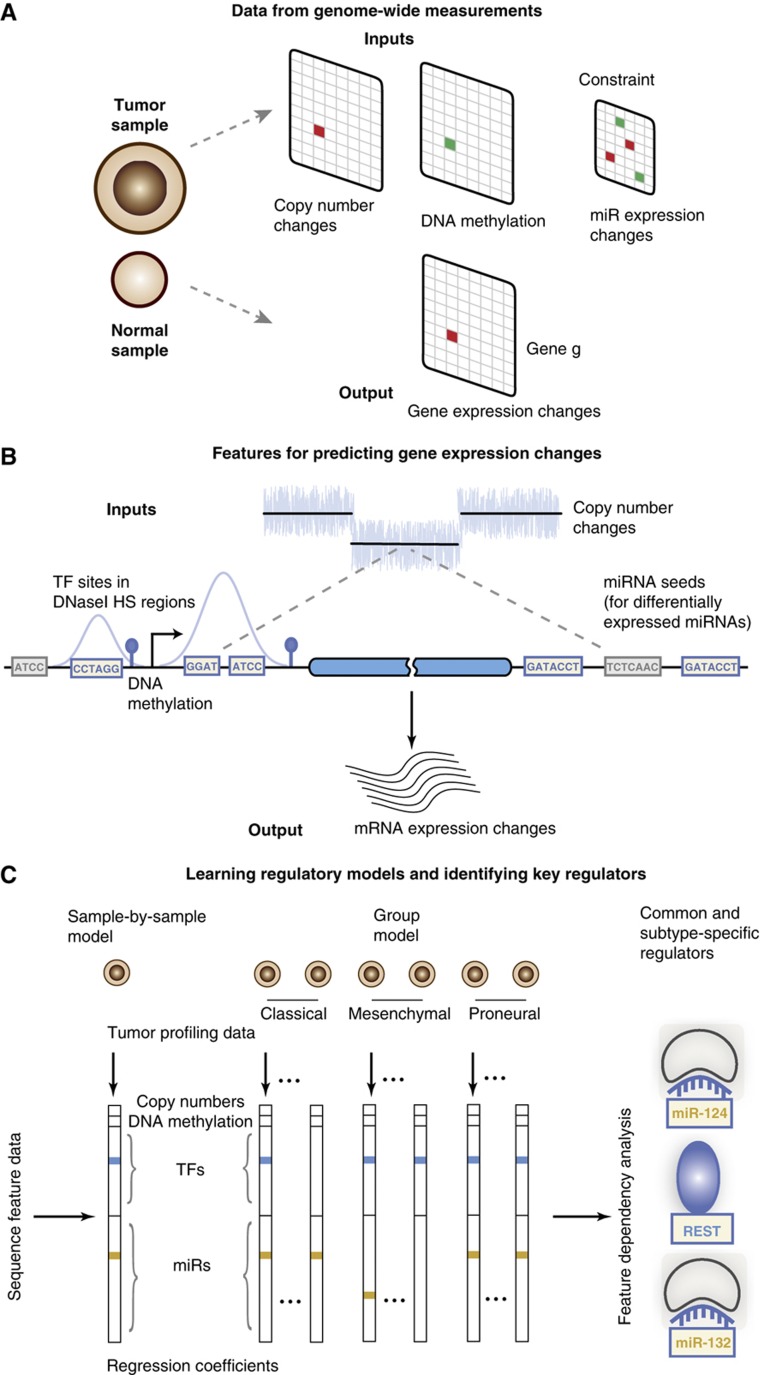
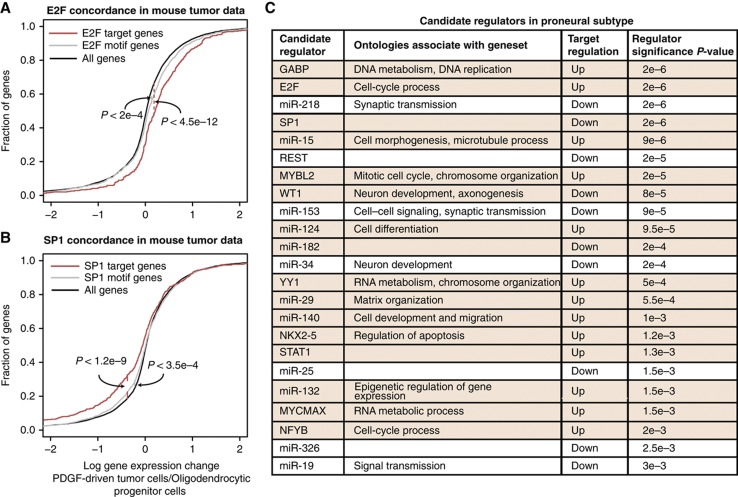
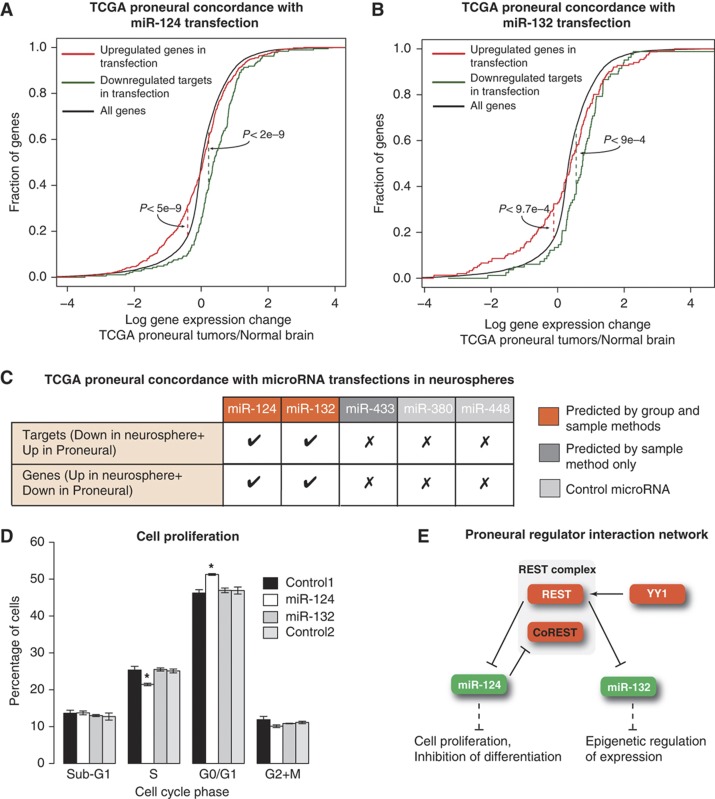
Large-scale cancer genomics projects are profiling hundreds of tumors at multiple molecular layers, including copy number, mRNA and miRNA expression, but the mechanistic relationships between these layers are often excluded from computational models. We developed a supervised learning framework for integrating molecular profiles with regulatory sequence information to reveal regulatory programs in cancer, including miRNA-mediated regulation. We applied our approach to 320 glioblastoma profiles and identified key miRNAs and transcription factors as common or subtype-specific drivers of expression changes. We confirmed that predicted gene expression signatures for proneural subtype regulators were consistent with in vivo expression changes in a PDGF-driven mouse model. We tested two predicted proneural drivers, miR-124 and miR-132, both underexpressed in proneural tumors, by overexpression in neurospheres and observed a partial reversal of corresponding tumor expression changes. Computationally dissecting the role of miRNAs in cancer may ultimately lead to small RNA therapeutics tailored to subtype or individual.


Conflict of interest statement

The authors declare that they have no conflict of interest.

Figures

Figure 1
Figure 1
Modeling gene expression changes in tumors to identify dysregulated transcription factors and microRNAs. (A) Genome-wide measurements like copy number, DNA methylation, and miRNA expression are used to predict gene expression changes of tumor samples relative to normal references. (B) To infer dysregulated regulatory programs from tumor profiling data, change in gene expression in a tumor sample is modeled as linear function of the gene’s copy number, DNA methylation at the promoter (when available for the sample), and counts of transcription factor binding sites in the DNaseI hypersensitive regions of the gene’s promoter and conserved miRNA binding sites in the 3′UTR. (C) The linear model is trained for all tumors, either on a sample-by-sample basis or simultaneously by using a group approach, on all Refseq genes using sparse regression so that only a few explanatory variables have non-zero regression coefficients. In particular, only a small number of transcription factors (TFs) and miRNAs, that is, those whose binding sites best correlate with target gene expression changes in the tumor sample, enter into the regression model. Feature dependency analysis on these regression models identifies common and subtype-specific regulators.
Figure 2
Figure 2
Sparse regression models predict differential expression of held-out genes and subtypes of tumor samples. (A) Plot showing Spearman correlations between predicted and actual gene expression changes for all samples, sorted based on performance of the group lasso model using copy numbers, TF binding sites, and miRNA binding sites. For each method and each sample, the Spearman correlation is computed using 10-fold cross-validation on held-out genes. Using only TFs and miRNAs as features is significantly better than random (P<2.2e−16, Wilcoxon signed-rank test); adding copy numbers for the full sample lasso model significantly improves cross-validation performance over using only TFs and miRNAs (P<2.2e−16), while the group lasso approach outperforms the full lasso model (P<2.2e−16). TCGA subtypes are shown in the top bar. Cross-validation performance is uniform across the three main subtypes. (B) Unsupervised hierarchical clustering of tumors of proneural and mesenchymal subtypes by their sample-specific lasso model coefficients (shown as columns in the heatmap) separates proneural from mesenchymal samples. The clustering was performed using all features, but for clarity only the features with largest mean aggregate squared error changes (Figure 3A) are shown in the heatmap.
Figure 3
Figure 3
Feature analysis of group models identifies common and subtype-specific regulators and their target gene sets. (A) Regulators are ranked based on increase in squared error across samples of a subtype after excluding the regulator from regression models. Candidate regulators for each subtype are identified at an FDR of 10% relative to regression models trained on randomized data. The plot of aggregate error changes for the proneural subtype is shown. (B) Gene sets associated with each candidate regulator are determined similarly by excluding the regulator from regression models and identifying genes whose squared error across samples increases (using an FDR of 10%). The distribution of gene expression changes is shown for all genes, all targets based on motif hits, and the gene set for GABP, a candidate regulator of proneural subtype, across TCGA proneural tumors. GABP motif-based targets are significantly upregulated compared with all genes (P<6.8e−8, Kolmogorov–Smirnov test); GABP’s gene set is more strongly upregulated than the motif-based targets (P<2.2e−16) in both training samples and held-out test samples. (C) The model coefficients of miR-132, a proneural-specific candidate regulator, are predictive of survival in the proneural GBM subtype. Patients with high model coefficient (>55th percentile) show a significantly higher median survival time compared with patients with low model coefficient (<45th percentile; P<7e−4, log-rank test). (D) Venn diagram showing the candidate regulators across classical, mesenchymal, and proneural subtypes. Regulators with target upregulation are shown in brown and with target downregulation in blue. A number of regulators are common for all subtypes, while there are no candidate regulators specific to the proneural and mesenchymal subtypes alone.
Figure 4
Figure 4
Gene sets for candidate proneural regulators display coherent functional annotations and consistent in vivo expression changes in PDGF-driven mouse tumors. (A) Targets of E2F, a proneural candidate regulator, show significant upregulation in PDGF-driven Olig2+ mouse tumor cells relative to mouse oligodendrocyte progenitor cells (OPCs) (P<2e−4, Kolmogorov–Smirnov test). Upregulation of the proneural E2F gene set is stronger than the motif-based target set (P<4.5e−12). Human genes were mapped to mouse genes using Homologene. (B) Targets of SP1 show significant downregulation in mouse tumor cells relative to OPCs (P<3.5e−4). Downregulation of proneural SP1 gene set is stronger than motif-based target set (P<1.2e−9). (C) The table lists candidate proneural regulators selected at 10% FDR. Functional annotations were determined by looking for overrepresented terms from the Gene Ontology ‘Biological Process’ in gene sets associated with the candidate regulator. Regulators concordant with PDGF-driven Olig2+ mouse tumor data are shown with rows highlighted in brown. Proneural regulators are ranked by their significance in the regression model, assessed by empirical P-values relative to the previously described randomized models and corrected for multiple-hypothesis testing using the Benjamini-Hochberg procedure.
Figure 5
Figure 5
Overexpression of candidate proneural miRNAs in neurospheres drives expression changes consistent with their predicted role in tumors. (A) Expression changes after miR-124 overexpression in a proneural (PDGFRA-amplified) neurosphere were concordant with miR-124 associated tumor versus normal expression changes, where miR-124 is underexpressed. Targets of miR-124 that were downregulated in the neurosphere model and genes those were upregulated after miR-124 transfection are upregulated and downregulated, respectively, in TCGA proneural samples. These results suggest that overexpression of miR-124 in neurospheres partially reverses the expression changes in proneural tumors. (B) miR-132 also shows expression concordance in proneural tumors and miR-132 overexpression in neurospheres. (C) Common regulator miR-124 and proneural-specific regulator miR-132 show concordant gene expression changes between transfection in neurosphere and TCGA proneural samples. Two control microRNAs (miR-380 and miR-448), both downregulated in proneural samples but not selected in the regression analysis, do not show this concordance. A final tested miRNA, miR-443, was downregulated in proneural samples and chosen as a regulator by sample-based regression models but not the group lasso method and does not show significant concordance between expression changes (Supplementary Table 9). (D) Cell proliferation analysis demonstrates a significant decrease in number of cells in S phase and significant increase in number of cells in G0/G1 phase in miR-124 transfection compared with negative controls. These results are consistent with gene ontology analysis of miR-124 transfection data. Values represent mean±standard deviation of three replicate experiments (*P<2e−5, t-test). (E) Examination of identified regulators and existing literature suggests a proneural-specific core regulatory network. REST, a repressor of neural genes in non-neuronal cells, is known to be upregulated in brain tumors. YY1, inferred as an activator in proneural tumors, is a known activator of REST. Upregulation of REST may lead to downregulation of the miRNAs miR-124 (a predicted regulator in all subtypes) and miR-132 (a predicted regulator specific to proneural subtype). Downregulation of miR-124 and miR-132 may contribute to inhibition of differentiation and proliferation in tumors. Source data is available for this figure in the Supplementary Information.

Similar articles

Cited by

References

    1. Akavia UD, Litvin O, Kim J, Sanchez-Garcia F, Kotliar D, Causton HC, Pochanard P, Mozes E, Garraway LA, Pe'er D (2010) An integrated approach to uncover drivers of cancer. Cell 143: 1005–1017 - PMC - PubMed
    1. Alvarez-Saavedra M, Antoun G, Yanagiya A, Oliva-Hernandez R, Cornejo-Palma D, Perez-Iratxeta C, Sonenberg N, Cheng HY (2011) miRNA-132 orchestrates chromatin remodeling and translational control of the circadian clock. Hum Mol Genet 20: 731–751 - PMC - PubMed
    1. Andres ME, Burger C, Peral-Rubio MJ, Battaglioli E, Anderson ME, Grimes J, Dallman J, Ballas N, Mandel G (1999) CoREST: a functional corepressor required for regulation of neural-specific gene expression. Proc Natl Acad Sci USA 96: 9873–9878 - PMC - PubMed
    1. Basso K, Margolin AA, Stolovitzky G, Klein U, Dalla-Favera R, Califano A (2005) Reverse engineering of regulatory networks in human B cells. Nat Genet 37: 382–390 - PubMed
    1. Betel D, Koppal A, Agius P, Sander C, Leslie C (2010) Comprehensive modeling of microRNA targets predicts functional non-conserved and non-canonical sites. Genome Biol 11: R90. - PMC - PubMed

Publication types