

Biodistribution and endocytosis of ICAM-1-targeting antibodies versus nanocarriers in the gastrointestinal tract in mice
- PMID: 22915850
- PMCID: PMC3418107
- DOI: 10.2147/IJN.S34105
Biodistribution and endocytosis of ICAM-1-targeting antibodies versus nanocarriers in the gastrointestinal tract in mice
Abstract
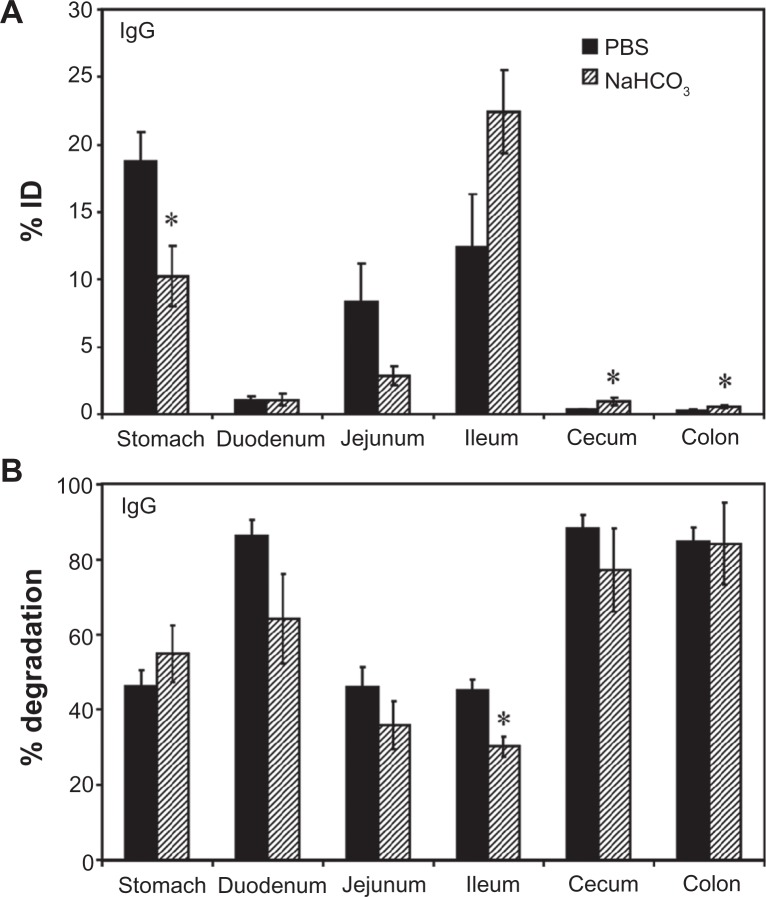
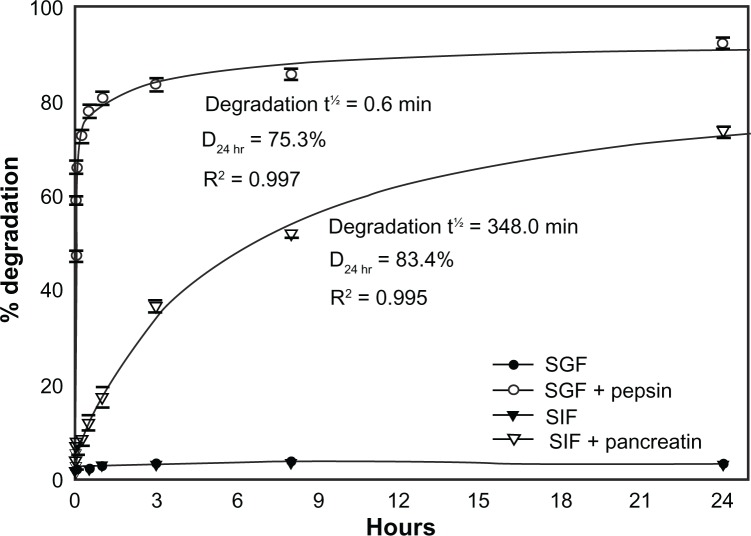
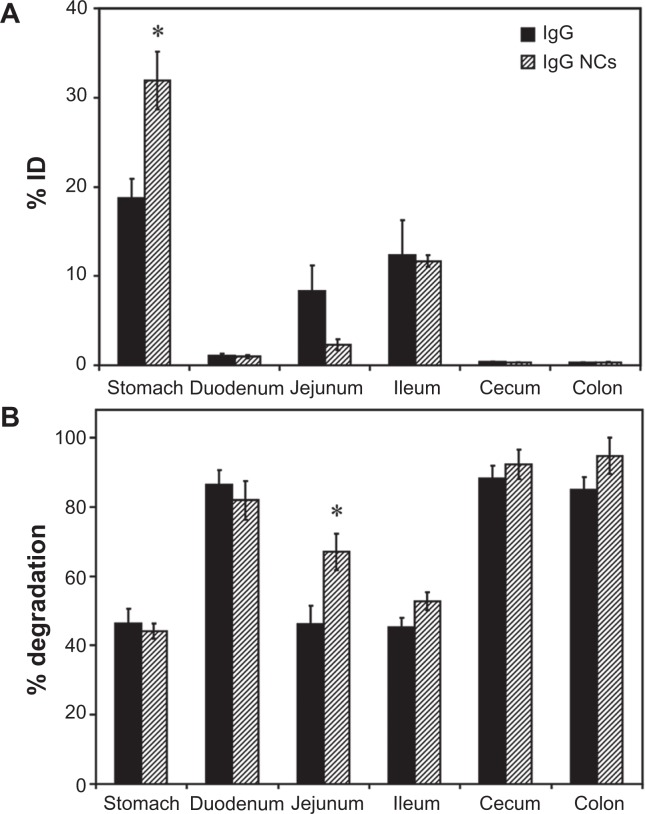
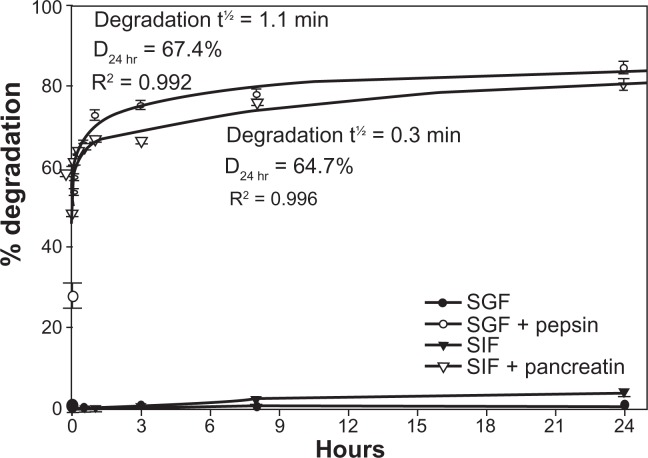
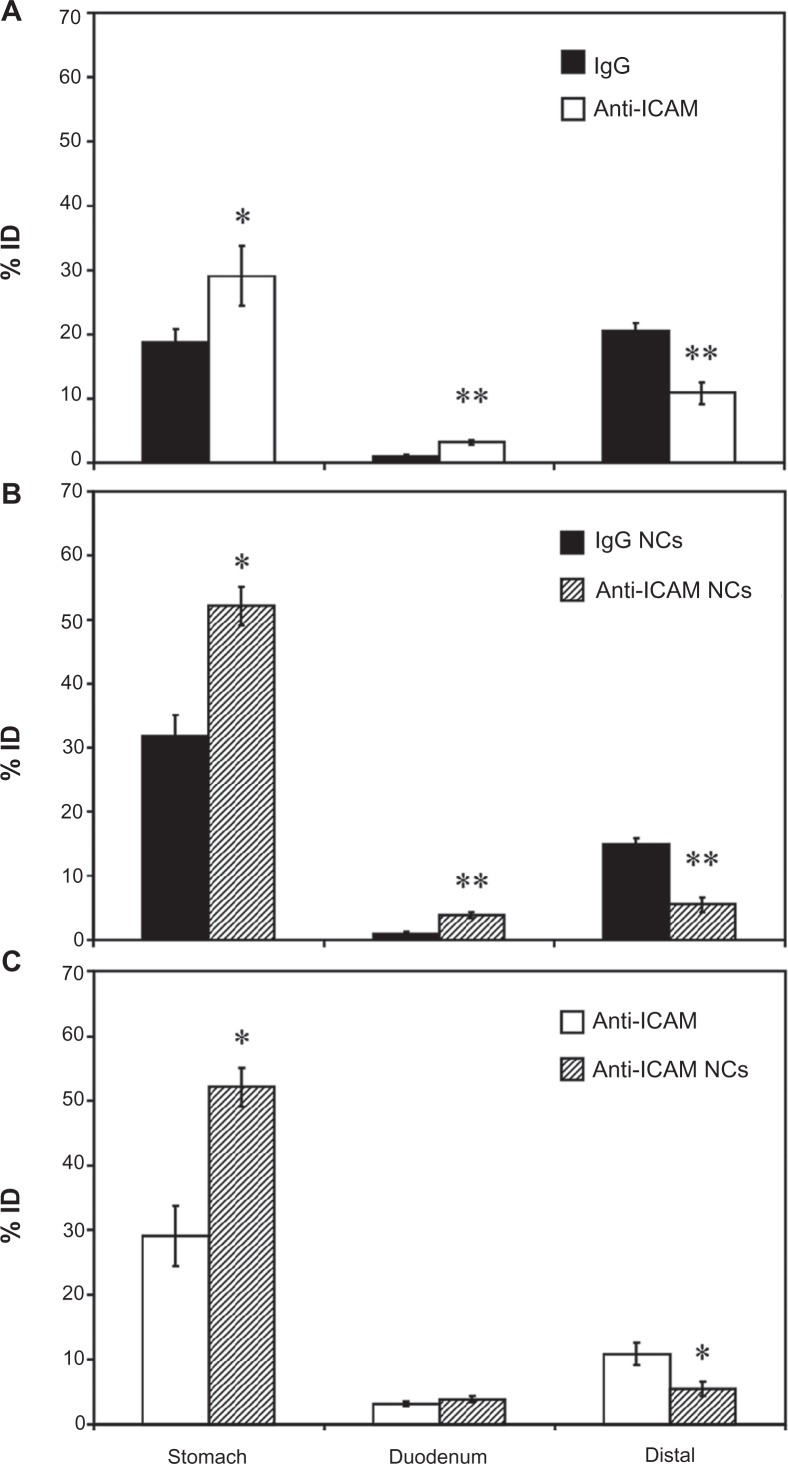
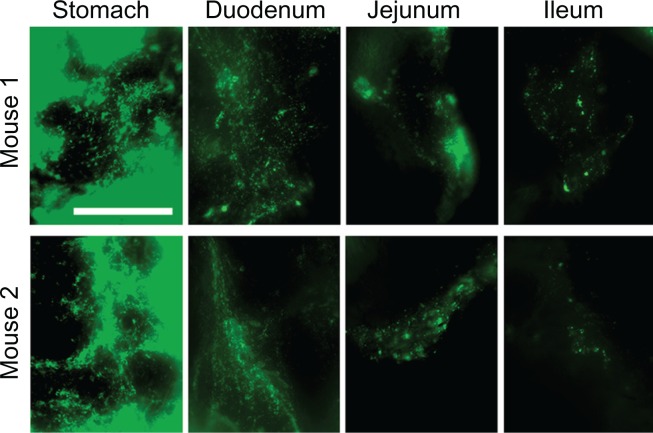
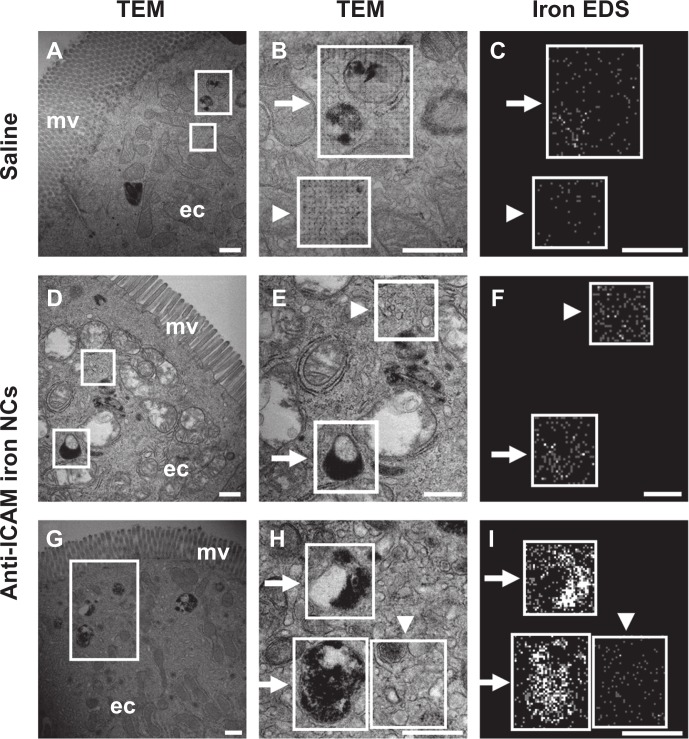
Drug delivery to the gastrointestinal (GI) tract is key for improving treatment of GI maladies, developing oral vaccines, and facilitating drug transport into circulation. However, delivery of formulations to the GI tract is hindered by pH changes, degradative enzymes, mucus, and peristalsis, leading to poor GI retention. Targeting may prolong residence of therapeutics in the GI tract and enhance their interaction with this tissue, improving such aspects. We evaluated nanocarrier (NC) and ligand-mediated targeting in the GI tract following gastric gavage in mice. We compared GI biodistribution, degradation, and endocytosis between control antibodies and antibodies targeting the cell surface determinant intercellular adhesion molecule 1 (ICAM-1), expressed on GI epithelium and other cell types. These antibodies were administered either as free entities or coated onto polymer NCs. Fluorescence and radioisotope tracing showed proximal accumulation, with preferential retention in the stomach, jejunum, and ileum; and minimal presence in the duodenum, cecum, and colon by 1 hour after administration. Upstream (gastric) retention was enhanced in NC formulations, with decreased downstream (jejunal) accumulation. Of the total dose delivered to the GI tract, ∼60% was susceptible to enzymatic (but not pH-mediated) degradation, verified both in vitro and in vivo. Attenuation of peristalsis by sedation increased upstream retention (stomach, duodenum, and jejunum). Conversely, alkaline NaHCO(3), which enhances GI transit by decreasing mucosal viscosity, favored downstream (ileal) passage. This suggests passive transit through the GI tract, governed by mucoadhesion and peristalsis. In contrast, both free anti-ICAM and anti-ICAM NCs demonstrated significantly enhanced upstream (stomach and duodenum) retention when compared to control IgG counterparts, suggesting GI targeting. This was validated by transmission electron microscopy and energy dispersive X-ray spectroscopy, which revealed anti-ICAM NCs in vesicular compartments within duodenal epithelial cells. These results will guide future work aimed at improving intraoral delivery of targeted therapeutics for the treatment of GI pathologies.
Keywords: ICAM-1 targeting; antibody; endocytosis; gastrointestinal tract; polymer nanocarriers.
Figures
Similar articles
-
Transport of nanocarriers across gastrointestinal epithelial cells by a new transcellular route induced by targeting ICAM-1.J Control Release. 2012 Oct 10;163(1):25-33. doi: 10.1016/j.jconrel.2012.06.007. Epub 2012 Jun 12. J Control Release. 2012. PMID: 22698938 Free PMC article.
-
Comparative binding, endocytosis, and biodistribution of antibodies and antibody-coated carriers for targeted delivery of lysosomal enzymes to ICAM-1 versus transferrin receptor.J Inherit Metab Dis. 2013 May;36(3):467-77. doi: 10.1007/s10545-012-9534-6. Epub 2012 Sep 12. J Inherit Metab Dis. 2013. PMID: 22968581 Free PMC article.
-
Chitosan-Alginate Microcapsules Provide Gastric Protection and Intestinal Release of ICAM-1-Targeting Nanocarriers, Enabling GI Targeting In Vivo.Adv Funct Mater. 2016 May 24;26(20):3382-3393. doi: 10.1002/adfm.201600084. Epub 2016 Apr 23. Adv Funct Mater. 2016. PMID: 27375374 Free PMC article.
-
Nanoparticles for oral delivery: Design, evaluation and state-of-the-art.J Control Release. 2016 Oct 28;240:504-526. doi: 10.1016/j.jconrel.2016.06.016. Epub 2016 Jun 9. J Control Release. 2016. PMID: 27292178 Free PMC article. Review.
-
Surface design of nanocarriers: Key to more efficient oral drug delivery systems.Adv Colloid Interface Sci. 2023 Mar;313:102848. doi: 10.1016/j.cis.2023.102848. Epub 2023 Feb 3. Adv Colloid Interface Sci. 2023. PMID: 36780780 Review.
Cited by
-
A holistic approach to targeting disease with polymeric nanoparticles.Nat Rev Drug Discov. 2015 Apr;14(4):239-47. doi: 10.1038/nrd4503. Epub 2015 Jan 19. Nat Rev Drug Discov. 2015. PMID: 25598505 Free PMC article. Review.
-
Assessing the barriers to image-guided drug delivery.Wiley Interdiscip Rev Nanomed Nanobiotechnol. 2014 Jan-Feb;6(1):1-14. doi: 10.1002/wnan.1247. Epub 2013 Oct 31. Wiley Interdiscip Rev Nanomed Nanobiotechnol. 2014. PMID: 24339356 Free PMC article. Review.
-
Oral nanomedicine for modulating immunity, intestinal barrier functions, and gut microbiome.Adv Drug Deliv Rev. 2021 Dec;179:114021. doi: 10.1016/j.addr.2021.114021. Epub 2021 Oct 26. Adv Drug Deliv Rev. 2021. PMID: 34710529 Free PMC article. Review.
-
Receptor-mediated targeted drug delivery systems for treatment of inflammatory bowel disease: Opportunities and emerging strategies.Acta Pharm Sin B. 2021 Sep;11(9):2798-2818. doi: 10.1016/j.apsb.2020.11.003. Epub 2020 Nov 7. Acta Pharm Sin B. 2021. PMID: 34589398 Free PMC article. Review.
-
Targeted endothelial nanomedicine for common acute pathological conditions.J Control Release. 2015 Dec 10;219:576-595. doi: 10.1016/j.jconrel.2015.09.055. Epub 2015 Oct 3. J Control Release. 2015. PMID: 26435455 Free PMC article. Review.
References
-
- Park K, Kwon IC, Park K. Oral protein delivery: current status and future prospect. React Funct Polym. 2011;71(3):280–287.
-
- Mrsny RJ. Modification of epithelial tight junction integrity to enhance transmucosal absorption. Crit Rev Ther Drug Carrier Syst. 2005;22(4):331–418. - PubMed
-
- Tuma PL, Hubbard AL. Transcytosis: crossing cellular barriers. Physiol Rev. 2003;83(3):871–932. - PubMed
-
- Sastry SV, Nyshadham JR, Fix JA. Recent technological advances in oral drug delivery – a review. Pharm Sci Technolo Today. 2000;3(4):138–145. - PubMed
-
- Bender BG, Sazonov V, Krobot KJ. Impact of medication delivery method on patient adherence. In: Harver A, Kotses H, editors. Asthma, Health and Society. New York: Springer US; 2010. pp. 107–115.
Publication types
MeSH terms
Substances
Grants and funding
LinkOut - more resources
Full Text Sources
Miscellaneous
