. 2012;7(8):e42823.
doi: 10.1371/journal.pone.0042823. Epub 2012 Aug 13.

GFAP isoforms in adult mouse brain with a focus on neurogenic astrocytes and reactive astrogliosis in mouse models of Alzheimer disease

Affiliations

GFAP isoforms in adult mouse brain with a focus on neurogenic astrocytes and reactive astrogliosis in mouse models of Alzheimer disease

Willem Kamphuis et al. PLoS One. 2012.

Abstract

Glial fibrillary acidic protein (GFAP) is the main astrocytic intermediate filament (IF). GFAP splice isoforms show differential expression patterns in the human brain. GFAPδ is preferentially expressed by neurogenic astrocytes in the subventricular zone (SVZ), whereas GFAP(+1) is found in a subset of astrocytes throughout the brain. In addition, the expression of these isoforms in human brain material of epilepsy, Alzheimer and glioma patients has been reported. Here, for the first time, we present a comprehensive study of GFAP isoform expression in both wild-type and Alzheimer Disease (AD) mouse models. In cortex, cerebellum, and striatum of wild-type mice, transcripts for Gfap-α, Gfap-β, Gfap-γ, Gfap-δ, Gfap-κ, and a newly identified isoform Gfap-ζ, were detected. Their relative expression levels were similar in all regions studied. GFAPα showed a widespread expression whilst GFAPδ distribution was prominent in the SVZ, rostral migratory stream (RMS), neurogenic astrocytes of the subgranular zone (SGZ), and subpial astrocytes. In contrast to the human SVZ, we could not establish an unambiguous GFAPδ localization in proliferating cells of the mouse SVZ. In APPswePS1dE9 and 3xTgAD mice, plaque-associated reactive astrocytes had increased transcript levels of all detectable GFAP isoforms and low levels of a new GFAP isoform, Gfap-ΔEx7. Reactive astrocytes in AD mice showed enhanced GFAPα and GFAPδ immunolabeling, less frequently increased vimentin and nestin, but no GFAPκ or GFAP(+1) staining. In conclusion, GFAPδ protein is present in SVZ, RMS, and neurogenic astrocytes of the SGZ, but also outside neurogenic niches. Furthermore, differential GFAP isoform expression is not linked with aging or reactive gliosis. This evidence points to the conclusion that differential regulation of GFAP isoforms is not involved in the reorganization of the IF network in reactive gliosis or in neurogenesis in the mouse brain.


Conflict of interest statement

Competing Interests: The authors have declared that no competing interests exist.

Figures

Figure 1
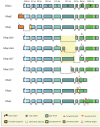
Figure 1. Schematic representation of the different mouse GFAP isoforms studied.
The scheme illustrates the differential splicing routes resulting in 10 different Gfap transcript isoforms. The 9 exons containing the canonical Gfap-α isoform is shown on top. Size of the depicted exons is to scale except for exon 1 and 9, indicated by breaks. The target position of primers used for qPCR assays are indicated (see Table S1 for their sequences). The position of the epitope for the isoform-specific antibodies generated by us is indicated. Note that only the full-length sequences of mouse Gfap-α, Gfap-δ , and Gfap-κ were identified by us. Transcripts encoding for GfapΔ135, and the GFAP+1 variants (GfapΔ164 and GfapΔEx6), as found in human brain , were not detected by qPCR. We found evidence for the existence of GfapΔEx7, a potential GFAP+1 variant, but no effort was made to clone the full-length sequence. Gfap-δ and Gfap-κ each encode for a unique C-terminal amino acid sequence of 41 aa and 46 aa, respectively, different from the Gfap-α encoded C-terminus. Gfap-β was decribed for rat brain , Gfap-γ and Gfap-ζ were isolated from mouse brain .
Figure 2
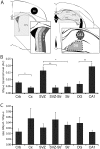
Figure 2. Transcript levels.
(A) Schematic drawings of coronal sections to illustrate the areas isolated by LDM for RNA isolation. (B) Normalized transcript levels of Gfap-α in different brain areas in arbitrary units (AU). Gfap-α displays differential transcript levels between brain areas. Note the enhanced levels in the SVZ compared to the adjacent tissue. (C) Ratio of Gfap-δ/Gfap-α transcript levels shows no detectable differences between brain regions. Data is presented as mean ± SEM, n = 7. * P<0.05; ** P<0.01.
Figure 3
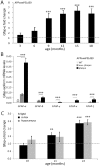
Figure 3. Transcript levels in aged APPswePS1dE9 and 3xTgAD mice.
(A) Transcript levels of Gfap-α in cortex of APPswePS1dE9 mice increase with age (months). Data is presented as fold change ± SEM compared to age-matched WT animals (dashed line). Student’s t-test against age-matched WT mice. (B) Transcript levels of Gfap isoforms in LMPC isolated tissue samples from the cortex of 9 month old WT and APPswePS1dE9 mice (arbitrary units). In WT, Gfap-α and Gfap-δ could be detected but none of the other isoforms. In plaque samples from APPswePS1dE9, Gfap-α was detected at significantly higher levels compared to WT and to non-plaque samples. Gfap-δ, Gfap-γ, Gfap-κ, and Gfap-ζ were detectable in all AD plaque samples and in non-plaque samples at significantly lower levels. Data is presented as mean ± SEM, n = 7 for AD and n = 8 for WT. Statistics: Gfap-α WT vs. APPswePS1dE9: Mann-Whitney U-test and plaque-vs. non plaque: Wilcoxon matched pair signed rank test. (C) Transcript levels of Gfap-α in cortex and hippocampus of 3xTgAD mice increase with age. Data is presented as fold change ± SEM compared to age-matched WT animals (dashed line). Student’s T-test against age-matched WT mice. * P<0.05; ** P<0.01; *** P<0.001.
Figure 4
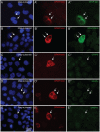
Figure 4. GFAPα transfected cells stained with various GFAP antibodies.
All panels show SW13/cl.2 cells transfected with full length msGfap-α, stained with GFAP monoclonal antibody to detect successfully transfected cells and double stained with the different polyclonals. (A–A’) GFAPpan and (B–B’) GFAPc-term antisera are able to detect GFAPα composed IF networks, whereas (C–C’) msGFAPδ, (D–D’) msGFAPκ, and (E–E’) msGFAP+1 display no reactivity against the canonical GFAPα. Panels A–E show DAPI staining, a fluorescent stain that binds to DNA.
Figure 5
Figure 5. Western blots on transfected SW13/cl.2 cells.
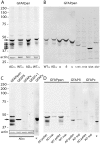
Protein samples prepared from SW13/cl.2 cells transfected with 7 different GFAP-isoforms, indicated at the top of each lane, were blotted. Blots were incubated with GFAP isoform-specific antibodies indicated at the bottom of each panel: (A) GFAPpan, detecting all isoforms. Note the small difference in molecular weight of GFAPα and GFAPδ in the transfected cells. (B) GFAPc-term, detecting the C-terminal sequence encoded by exon 9 only present in GFAPα and GFAPΔ135, (C) msGFAPδ, showing specificity for GFAPδ, (D) msGFAPκ, showing specificity for GFAPκ, and (E) msGFAP+1 antibody able to detect the GFAP isoforms typified by the +1 shifted reading frame in GFAPΔ164, GFAPΔEx6, and GFAPΔEx7.
Figure 6
Figure 6. Expression of GFAP isoforms results in different IF network morphologies.
Expression of GFAP isoforms in SW13/cl.2 cells. Transfected cultures were double stained with GFAPmono in order to identify successfully transfected cells and with the different GFAP antibodies listed in Table 3. The selection shown here illustrates that GFAPα is the only isoform yielding a network composed of long filaments (A), whereas GFAPδ (B), GFAPκ (C), GFAPΔ135 (D), GFAPΔ164 (E), GFAPΔex6 (F), and GFAPΔEx7 (G) lead to aberrant networks. When msGFAPδ was overexpressed in U343, a human astrocytoma cell line with an endogenous IF network, the resulting msGFAPδ network showed longer filaments (H) (compare with 4B), but this network was different from the much weaker endogenous network of GFAP composed of GFAPα and GFAPδ observed in non-transfected cells recorded at longer exposure time (I).
Figure 7
Figure 7. Co-expression of GFAPα and GFAPδ at different ratios results in different IF network morphologies.
Co-transfection of SW13/cl.2 cells with different ratios of GFAPα and GFAPδ encoding vectors. Transfected cultures fixed 24 h after transfection and stained with GFAPpan to study the morphology of the resulting IF networks. Transfection of GFAPα without GFAPδ yielded complex networks composed of long filaments present throughout the cell (A), whereas 75% GFAPα/25% GFAPδ results in condensed networks (B). A 50% GFAPα/50% GFAPδ ratio yields small networks or just isolated short filaments (C). At 25% GFAPα/75% GFAPδ and 100% GFAPδ only short “squiggles” were observed (D–F).
Figure 8
Figure 8. Western blots of mouse cortex WT and AD 12–15 month cortex samples.
(A) Protein samples (30 µg/lane) from cortex of two pairs of AD and WT mice aged 15 months (left lanes) and 9 month old (right lanes). Blot was probed with the GFAPpan antibody (1∶6000) revealing several bands (arrows). As check for comparable loading of the lanes, blots were also probed for actin (rectangular insert). (B) Protein samples from cortex of 15 month WT and AD (15 µg/lane) and lysates of cells transfected with the different isoforms. Blots were probed with the GFAPpan antibody (1∶6000). Alignment of the cell lysates with the cortex samples does not yield clear identification of the multiple bands detected in the cortex. (C) Identical protein samples (15 µg/lane) of a 9 month old AD mouse were run in adjacent lanes and probed with GFAPpan (1∶6000), GFAPδ (1∶2000), GFAPκ (1∶500), and GFAP+1 (1∶500). In line with the immunohistochemical data only GFAPδ detected a single band corresponding with the slightly smaller-sized band than the dominant GFAPpan band around 48 kDa (arrow). Insert shows detection of actin in the same lanes. As positive control for GFAPκ, a lysate of GFAPκ transfected cells was run in parallel. (D) Protein samples (15 µg/lane) from pellet and supernatant (sup) fractions were run and blotted and probed with GFAPpan (1∶6000), GFAPδ (1∶2000), and GFAPκ (1∶500). For both AD and WT, most GFAP is present in the pellet fraction with a small amount located in the soluble fraction typically only the largest of the GFAPpan bands. GFAPδ is present in the pellet and GFAPκ was not detected as was GFAP+1 (not shown). As positive control for GFAPκ, a lysate of GFAPκ transfected cells was run in parallel.
Figure 9
Figure 9. GFAPα and GFAPδ stainings in mouse brain.
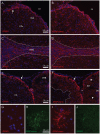
Two adjacent sagittal sections were both incubated with the same mix of GFAPc-term (raised in goat) and GFAPδ (raised in rabbit) antibodies. Thereafter one section was incubated with donkey-anti-goat-Cy3 and donkey-anti-rabbit-DL488-Cy3. The other section with donkey-anti-goat-DL488 and donkey-anti-rabbit-Cy3. Shown are photomicrographs recorded from the Cy3 channel in both sections, all recorded and processed at identical settings. This avoids any bias caused by the different sensitivities of detection by either Cy3 or DL488 fluorophores. The 6 µm thick sections were cut from frozen brains and after mounting on glass slide shortly fixed with PFA. This procedure was optimal for both antibodies. (A,B) Lateral ventricle (LV), SVZ and caudate putamen (CPu). Arrow indicates the start of the RMS towards the olfactory bulb at the left. Both GFAPc-term the localization of GFAPδ in processes in the SVZ while GFAPc-term is expressed in the SVZ and in fine processes in CPu. Visualization in the DL488 channel confirms this pattern. (C,D) Sections showing the end of the RMS near the olfactory bulb. GFAPδ and GFAPc-term stain processes in the RMS with the surrounding parenchyma is mostly GFAPc-term. (E,F) GFAPδ is highly expressed in astrocytes near the pial surface of cortex (CX; arrow). In cerebellum (CRB) no GFAPδ staining is observed. A large arterial blood vessel stains for GFAPδ (asterisk). GFAPc-term labels glial processes in stratum moleculare (SM) and stratum granulosum (SG; small arrows). The subpial zone in the cortex is GFAPc-term positive but GFAPδ negative. (G,H) Double staining of a GFAP-positive single protoplasmic astrocyte in the cortex to illustrate the near absence of GFAPδ. The same cell was observed in the adjacent section with reversed secondary antibodies (I,J).
Figure 10
Figure 10. Immunocytochemical stainings SVZ.
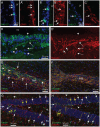
(A,A’) Staining for BrdU with short-term survival after the last BrdU injection reveals proliferating cells (arrows) in the SVZ of a 6 month old mouse. Assigning GFAPδ staining to a specific BrdU-labelled nucleus is not feasible. (B,B’) Double staining with GFAPpan and Ki67 as a marker for proliferating cells in the SVZ. (C,C’) Staining for BrdU after long-term survival after the last BrdU injection reveals only a few BrdU-positive cells in the SVZ. These cells represent the slowly dividing stem cell pool residing in the SVZ. No clear expression level of GFAPδ could be assigned to these cells. (D,D’) Double staining of nestin and GFAPδ demonstrates a clear co-localization of GFAPδ positive processes with nestin in the SVZ (short arrows) but deeper in the parenchyma GFAPδ processes are nestin negative (long arrows). Nestin is also localized in the ependymal cell layer (arrow head). (E) A section containing the RMS stained for GFAPδ and nestin. The olfactory bulb is located at the left. Note the prominent staining of long GFAPδ positive processes (arrows), most of which are also nestin-positive (short arrows) while those located more at the RMS border are nestin-negative (long arrows). Towards the olfactory bulb nestin-only processes becomes more prominent (arrow heads). (F) The adjacent section of the one shown in E but stained for GFAPδ and vimentin. Note the complete overlap of both patterns. (G) The hippocampal dentate region stained for GFAPδ and nestin. Short arrows indicate GFAPδ and nestin double positive fibers stretching into the granular cell layer typical for the SGZ stem cells. The cell bodies of these cells could not be identified. Long arrows indicate GFAPδ positive, nestin negative representing conventional astrocytes. Arrowheads point at nestin positive blood vessels. (H) The adjacent section of the one shown in G but stained for GFAPδ and vimentin. Short arrows indicate GFAPδ and vimentin double positive fibers stretching into the granular cell layer typical for the SGZ stem cells. Careful alignment on blood vessels identified process belonging to the same cells; indicated by yellow arrows demonstrating that GFAPδ, nestin, and vimentin are expressed by the same cells. RMS, rostral migratory stream; SG stratum granulosum; HL, hilus.
Figure 11
Figure 11. Immunocytochemical stainings for GFAP in cortex of APPswePS1dE9 mice.
(A) GFAPpan staining in a WT mouse cortex showing a faintly stained network of fine filaments and a single astrocyte with an intense staining (arrow). (B) GFAPpan staining in the cortex of a 6 month APPswePS1dE9 mouse with amyloid deposits (arrows), detected by Aβ staining (6E10), illustrating the close spatial association of amyloid and increased GFAP staining. (C) GFAPpan staining in the cortex of a 9 month APPswePS1dE9 mouse showing that the reactive gliosis remains associated with plaques visualized by Thioflavin-S staining (arrows). (D) GFAPδ staining is strongly enhanced in reactive astrocytes around a plaque identified by a diffuse staining in the DAPI channel (asterisk). (E,E’) Double staining of the goat polyclonal GFAPc-term and rabbit polyclonal GFAPδ demonstrating the perfect overlap of GFAPα and GFAPδ localization in reactive astrocytes (arrows) around a plaque (asterisk) in a 9 month old APPswePS1dE9 mouse. (F,F’) Double staining of GFAPmono and GFAPκ showed no GFAPκ specific staining around a plaque in a 9 month old APPswePS1dE9 mouse. (G,G’) Double staining of GFAPmono and GFAP+1 showed no GFAP+1 specific staining around a plaque in a 9 month old APPswePS1dE9 mouse.
Figure 12
Figure 12. Immunocytochemical stainings for GFAP in cortex of 3xTgAD mice.
(A) Intraneuronal APP/Aβ staining in neocortical neurons in layer 4/5 of 3xTgAD at 18 months. GFAPpan immunostaining does not show any reactive astrocytes. (B) Diffuse plaques (arrows) in the cortex of an 18 month old 3xTgAD female mouse are not surrounded by GFAPpan-positive reactive astrocytes. (C) Higher magnification of a cortical plaque (arrow) illustrating the absence of reactive gliosis. (D) Double staining for Aβ and microglia (Iba1) demonstrates the absence of microgliosis around a diffuse plaque (arrow). Arrowheads indicate the positions of individual Iba1-positive microglia without aggregation around plaques. (E) Some plaques in the cortex have a more compact amyloid structure (arrowhead) than the more diffuse plaques (arrows) and these deposits are surrounded by GFAPpan-positive reactive astrocytes. (F) Higher magnification of gliosis, demonstrated by GFAPc-term immunostaining around a compact plaque. (G,G’) Triple staining for Aβ and GFAPc-term and GFAPδ. Reactive astrocytes contacting plaques in 3xTgAD cortex are immunopositive for GFAPc-term and GFAPδ. (H) Hippocampal neurons with accumulated tau-protein (HT7 antibody) in 3xTgAD are not associated with reactive astrocytes.
Figure 13
Figure 13. Immunocytochemical stainings for Vimentin, Nestin, and Synemin in cortex of APPswePS1dE9 mice.
(A) Vimentin (VIM) immunostaining does not associate with all plaques detected by Aß (6E10) staining (15 month old animal). Only some of the plaques are surrounded by Vimentin-positive astrocytes (long arrows). Most Vimentin staining is located around blood vessels (short arrows). (B) Double staining of GFAPpan and nestin in a 6 month old mouse shows the absence of Nestin in most of the reactive astrocytes around plaques (asterisk). Nestin staining is mostly found associated with blood vessels (short arrows). (C,C’) A triple staining for Vimentin, GFAPpan and Synemin illustrating a rare example of enhanced nestin expression in GFAPpan-positive astrocytes around a plaque (asterisk) while Synemin expression (C') is absent (9 months). (D) Double staining for GFAPδ and nestin reveals that not all GFAPδ-positive reactive astrocytes around a plaque (asterisk) are nestin positive (short arrows) but some are (arrow). (E) Reactive astrocytes near plaques (asterisks) display only enhanced levels of GFAPpan that are only occasionally weakly positive for Synemin in a 9 month old mouse. Most Synemin staining is located around blood vessels. Ependymal cells were always strongly positive for Synemin in the same sections (not shown).

Similar articles

Cited by

References

    1. Sofroniew MV, Vinters HV (2010) Astrocytes: biology and pathology. Acta Neuropathol 119: 7–35. 10.1007/s00401-009-0619-8 [doi]. - PMC - PubMed
    1. Halassa MM, Haydon PG (2010) Integrated brain circuits: astrocytic networks modulate neuronal activity and behavior. Annu Rev Physiol 72: 335–355. 10.1146/annurev-physiol-021909-135843 [doi]. - PMC - PubMed
    1. Seth P, Koul N (2008) Astrocyte, the star avatar: redefined. J Biosci 33: 405–421. - PubMed
    1. Oberheim NA, Goldman SA, Nedergaard M (2012) Heterogeneity of astrocyte form and function. In: Walker JM, editors. Astrocytes. Methods and Protocols. Humana Press. 23–45.
    1. Doetsch F, Caille I, Lim DA, Garcia-Verdugo JM, Varez-Buylla A (1999) Subventricular zone astrocytes are neural stem cells in the adult mammalian brain. Cell 97: 703–716. - PubMed

Publication types

MeSH terms

Substances

Grants and funding

This work was supported by the Internationale Stichting Alzheimer Onderzoek (ISAO; M.O. [#08504]) and the Netherlands Organization for Scientific Research (NWO; VICI grant to E.M.H. [865.09.003]). The funders had no role in study design, data collection and analysis, decision to publish, or preparation of the manuscript.