Post-chemotherapy T-cell recovery is a marker of improved survival in patients with advanced thoracic malignancies
- PMID: 22910319
- PMCID: PMC3461157
- DOI: 10.1038/bjc.2012.362
Post-chemotherapy T-cell recovery is a marker of improved survival in patients with advanced thoracic malignancies
Abstract
Background: There is increasing interest in combining chemotherapy with immunotherapy. However, the effects of chemotherapy on the human immune system are largely unknown.
Methods: Longitudinal changes in peripheral T-cell subsets in 40 patients with malignant mesothelioma (MM) or advanced non-small cell lung cancer (NSCLC) receiving platinum-based chemotherapy were assessed by flow cytometry and evaluated for associations with clinical outcome.
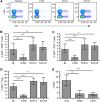
Results: Proliferating T cells of all subsets were almost entirely depleted at day 8 following chemotherapy, but rapidly recovered above baseline levels. Regulatory T cells (Treg) were most profoundly depleted at this time point. A greater increase in CD8(+) T-cell proliferation following one treatment cycle was associated with improved overall survival in univariate (hazard ratio (HR)=0.40; P<0.05) and multivariate (HR=0.17; P<0.01) analyses. A greater increase in the ratio of CD8(+) T cell to Treg proliferation was also predictive of better prognosis.
Conclusion: Chemotherapy potentially provides a favourable environment for the development of anti-tumour immunity through transient Treg depletion and regeneration of the T-cell pool. Change in CD8(+) T-cell proliferation after one cycle of chemotherapy may represent a useful prognostic indicator in patients with MM and NSCLC.
Figures


Similar articles
-
Peripheral CD8(+) T cell proliferation is prognostic for patients with advanced thoracic malignancies.Cancer Immunol Immunother. 2013 Mar;62(3):529-39. doi: 10.1007/s00262-012-1360-z. Epub 2012 Oct 16. Cancer Immunol Immunother. 2013. PMID: 23069871 Free PMC article.
-
Immunomodulatory Effect of Lentinan on Aberrant T Subsets and Cytokines Profile in Non-small Cell Lung Cancer Patients.Pathol Oncol Res. 2020 Jan;26(1):499-505. doi: 10.1007/s12253-018-0545-y. Epub 2018 Nov 20. Pathol Oncol Res. 2020. PMID: 30460541
-
Induction of Peripheral Effector CD8 T-cell Proliferation by Combination of Paclitaxel, Carboplatin, and Bevacizumab in Non-small Cell Lung Cancer Patients.Clin Cancer Res. 2019 Apr 1;25(7):2219-2227. doi: 10.1158/1078-0432.CCR-18-2243. Epub 2019 Jan 14. Clin Cancer Res. 2019. PMID: 30642911 Clinical Trial.
-
Immune modulations during chemoimmunotherapy & novel vaccine strategies--in metastatic melanoma and non small-cell lung cancer.Dan Med J. 2013 Dec;60(12):B4774. Dan Med J. 2013. PMID: 24355457 Review.
-
Immunotherapy combinations in advanced nonsmall cell lung cancer.Curr Opin Oncol. 2021 Jan;33(1):73-79. doi: 10.1097/CCO.0000000000000700. Curr Opin Oncol. 2021. PMID: 33186185 Review.
Cited by
-
Effects of Chemotherapy Agents on Circulating Leukocyte Populations: Potential Implications for the Success of CAR-T Cell Therapies.Cancers (Basel). 2021 May 6;13(9):2225. doi: 10.3390/cancers13092225. Cancers (Basel). 2021. PMID: 34066414 Free PMC article. Review.
-
Polysaccharides from Chinese Herbal Lycium barbarum Induced Systemic and Local Immune Responses in H22 Tumor-Bearing Mice.J Immunol Res. 2018 Jun 3;2018:3431782. doi: 10.1155/2018/3431782. eCollection 2018. J Immunol Res. 2018. PMID: 29967800 Free PMC article.
-
Immunotherapy for neuro-oncology: the critical rationale for combinatorial therapy.Neuro Oncol. 2015 Nov;17 Suppl 7(Suppl 7):vii32-vii40. doi: 10.1093/neuonc/nov178. Neuro Oncol. 2015. PMID: 26516225 Free PMC article. Review.
-
Advancements in adoptive CAR immune cell immunotherapy synergistically combined with multimodal approaches for tumor treatment.Bioact Mater. 2024 Sep 10;42:379-403. doi: 10.1016/j.bioactmat.2024.08.046. eCollection 2024 Dec. Bioact Mater. 2024. PMID: 39308543 Free PMC article. Review.
-
Patient-tailored modulation of the immune system may revolutionize future lung cancer treatment.BMC Cancer. 2012 Dec 5;12:580. doi: 10.1186/1471-2407-12-580. BMC Cancer. 2012. PMID: 23217146 Free PMC article. Review.
References
-
- Afeltra A, Galeazzi M, Sebastiani GD, Ferri GM, Caccavo D, Addessi MA, Marcolongo R, Bonomo L (1997) Coexpression of CD69 and HLADR activation markers on synovial fluid T lymphocytes of patients affected by rheumatoid arthritis: a three-colour cytometric analysis. Int J Exp Pathol 78(5): 331–336 - PMC - PubMed
-
- Anraku M, Cunningham KS, Yun Z, Tsao MS, Tsao MS, Zhang L, Keshavjee S, Johnston MR, de Perrot M (2008) Impact of tumor-infiltrating T cells on survival in patients with malignant pleural mesothelioma. J Thorac Cardiovasc Surg 135(4): 823–829 - PubMed
-
- Anraku M, Tagawa T, Wu L, Yun Z, Keshavjee S, Zhang L, Johnston MR, de Perrot M (2010) Synergistic antitumor effects of regulatory T cell blockade combined with pemetrexed in murine malignant mesothelioma. J Immunol 185(2): 956–966 - PubMed
-
- Bellone G, Novarino A, Vizio B, Brondino G, Addeo A, Prati A, Giacobino A, Campra D, Fronda GR, Ciuffreda L (2009) Impact of surgery and chemotherapy on cellular immunity in pancreatic carcinoma patients in view of an integration of standard cancer treatment with immunotherapy. Int J Oncol 34(6): 1701–1715 - PubMed
Publication types
MeSH terms
Substances
LinkOut - more resources
Full Text Sources
Medical
Research Materials

