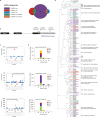
Unique expression, processing regulation, and regulatory network of peach (Prunus persica) miRNAs
- PMID: 22909020
- PMCID: PMC3542160
- DOI: 10.1186/1471-2229-12-149
Unique expression, processing regulation, and regulatory network of peach (Prunus persica) miRNAs
Abstract
Background: MicroRNAs (miRNAs) have recently emerged as important gene regulators in plants. MiRNAs and their targets have been extensively studied in Arabidopsis and rice. However, relatively little is known about the characterization of miRNAs and their target genes in peach (Prunus persica), which is a complex crop with unique developmental programs.
Results: We performed small RNA deep sequencing and identified 47 peach-specific and 47 known miRNAs or families with distinct expression patterns. Together, the identified miRNAs targeted 80 genes, many of which have not been reported previously. Like the model plant systems, peach has two of the three conserved trans-acting siRNA biogenesis pathways with similar mechanistic features and target specificity. Unique to peach, three of the miRNAs collectively target 49 MYBs, 19 of which are known to regulate phenylpropanoid metabolism, a key pathway associated with stone hardening and fruit color development, highlighting a critical role of miRNAs in the regulation of peach fruit development and ripening. We also found that the majority of the miRNAs were differentially regulated in different tissues, in part due to differential processing of miRNA precursors. Up to 16% of the peach-specific miRNAs were differentially processed from their precursors in a tissue specific fashion, which has been rarely observed in plant cells. The miRNA precursor processing activity appeared not to be coupled with its transcriptional activity but rather acted independently in peach.
Conclusions: Collectively, the data characterizes the unique expression pattern and processing regulation of peach miRNAs and demonstrates the presence of a complex, multi-level miRNA regulatory network capable of targeting a wide variety of biological functions, including phenylpropanoid pathways which play a multifaceted spatial-temporal role in peach fruit development.
Figures


Similar articles
-
Identification of miRNAs and their target genes in peach (Prunus persica L.) using high-throughput sequencing and degradome analysis.PLoS One. 2013 Nov 13;8(11):e79090. doi: 10.1371/journal.pone.0079090. eCollection 2013. PLoS One. 2013. PMID: 24236092 Free PMC article.
-
Identification and validation of potential conserved microRNAs and their targets in peach (Prunus persica).Mol Cells. 2012 Sep;34(3):239-49. doi: 10.1007/s10059-012-0004-7. Epub 2012 Aug 8. Mol Cells. 2012. PMID: 22878892 Free PMC article.
-
Genome wide identification of chilling responsive microRNAs in Prunus persica.BMC Genomics. 2012 Sep 15;13:481. doi: 10.1186/1471-2164-13-481. BMC Genomics. 2012. PMID: 22978558 Free PMC article.
-
MicroRNAs in fruit trees: discovery, diversity and future research directions.Plant Biol (Stuttg). 2014 Sep;16(5):856-65. doi: 10.1111/plb.12153. Epub 2014 Feb 19. Plant Biol (Stuttg). 2014. PMID: 24750383 Review.
-
The role of miRNAs in regulating gene expression networks.J Mol Biol. 2013 Oct 9;425(19):3582-600. doi: 10.1016/j.jmb.2013.03.007. Epub 2013 Mar 13. J Mol Biol. 2013. PMID: 23500488 Free PMC article. Review.
Cited by
-
Genome-Wide Analysis of Calmodulin Binding Transcription Activator (CAMTA) Gene Family in Peach (Prunus persica L. Batsch) and Ectopic Expression of PpCAMTA1 in Arabidopsis camta2,3 Mutant Restore Plant Development.Int J Mol Sci. 2022 Sep 10;23(18):10500. doi: 10.3390/ijms231810500. Int J Mol Sci. 2022. PMID: 36142414 Free PMC article.
-
Global Identification, Classification, and Expression Analysis of MAPKKK genes: Functional Characterization of MdRaf5 Reveals Evolution and Drought-Responsive Profile in Apple.Sci Rep. 2017 Oct 18;7(1):13511. doi: 10.1038/s41598-017-13627-2. Sci Rep. 2017. PMID: 29044159 Free PMC article.
-
In silico search and biological validation of microRNAs related to drought response in peach and almond.Funct Integr Genomics. 2017 May;17(2-3):189-201. doi: 10.1007/s10142-016-0488-x. Epub 2016 Apr 11. Funct Integr Genomics. 2017. PMID: 27068847
-
Phased secondary small interfering RNAs in Panaxnotoginseng.BMC Genomics. 2018 Jan 19;19(Suppl 1):41. doi: 10.1186/s12864-017-4331-0. BMC Genomics. 2018. PMID: 29363419 Free PMC article.
-
Small RNA Differential Expression Analysis Reveals miRNAs Involved in Dormancy Progression in Sweet Cherry Floral Buds.Plants (Basel). 2022 Sep 14;11(18):2396. doi: 10.3390/plants11182396. Plants (Basel). 2022. PMID: 36145795 Free PMC article.
References
-
- Lu C, Jeong DH, Kulkarni K, Pillay M, Nobuta K, German R, Thatcher SR, Maher C, Zhang L, Ware D. et al.Genome-wide analysis for discovery of rice microRNAs reveals natural antisense microRNAs (nat-miRNAs) Proc Natl Acad Sci USA. 2008;105(12):4951–4956. doi: 10.1073/pnas.0708743105. - DOI - PMC - PubMed
MeSH terms
Substances
LinkOut - more resources
Full Text Sources
Molecular Biology Databases

