. 2012 Nov 1;125(Pt 21):5221-32.
doi: 10.1242/jcs.111534. Epub 2012 Aug 16.

PKA isoforms coordinate mRNA fate during nutrient starvation

Affiliations

PKA isoforms coordinate mRNA fate during nutrient starvation

Vanesa Tudisca et al. J Cell Sci. .

Abstract

A variety of stress conditions induce mRNA and protein aggregation into mRNA silencing foci, but the signalling pathways mediating these responses are still elusive. Previously we demonstrated that PKA catalytic isoforms Tpk2 and Tpk3 localise with processing and stress bodies in Saccharomyces cerevisiae. Here, we show that Tpk2 and Tpk3 are associated with translation initiation factors Pab1 and Rps3 in exponentially growing cells. Glucose starvation promotes the loss of interaction between Tpk and initiation factors followed by their accumulation into processing bodies. Analysis of mutants of the individual PKA isoform genes has revealed that the TPK3 or TPK2 deletion affects the capacity of the cells to form granules and arrest translation properly in response to glucose starvation or stationary phase. Moreover, we demonstrate that PKA controls Rpg1 and eIF4G(1) protein abundance, possibly controlling cap-dependent translation. Taken together, our data suggest that the PKA pathway coordinates multiple stages in the fate of mRNAs in association with nutritional environment and growth status of the cell.


Figures

Fig. 1.
Fig. 1.
Analysis of Tpk accumulation and distribution between PBs and SGs during stationary phase and glucose starvation. (A) Cells coexpressing Dcp2–CFP, eIF4E–RFP and Tpk2–GFP or Tpk3–GFP were grown to stationary phase (SP), and refed with YPD medium for 10 or 40 minutes. (B) Cells expressing Tpk1–GFP, Tpk2–GFP or Tpk3–GFP or (C) coexpressing Dcp2–CFP, eIF4E–RFP and Tpk2–GFP or Tpk3–GFP grown to exponential phase and subjected to glucose starvation for 10 or 20 minutes. The numbers in each image indicate the total number of Tpk2–GFP, Tpk3–GFP, Dcp2–CFP, eIF4E–RFP granules, and triple colocalisation granules/100 cells in the merged images. The arrows indicate triple colocalisation granules. Scale bar: 5 µm. The bar chart shows the distribution of Tpk–GFP-containing granules/100 cells under each condition. Values are means ± s.d. (n = 5). Brackets denote significant differences (P<0.005).
Fig. 2.
Fig. 2.
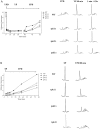
Tpk2 and Tpk3 show different dynamics and mechanisms for their association with PBs. Strains DCP2–RFP TPK2–GFP (A), DCP2–RFP TPK3–GFP (B), DCP2–RFP tpk2d–GFP (C), DCP2–RFP tpk3d–GFP (D) grown to exponential phase on SCD were washed with SC and visualized by fluorescence microscopy at 5-minute intervals, over a period of 60 minutes. The experimental setup dictates that the earliest possible time for image acquisition is 10 minutes after glucose starvation. The graphs show the number of granules/100 cells. Granules were categorized as those containing only Dcp2–RFP, only Tpk–GFP, or both proteins (colocalisation). (E) A representative cell from the experiment shown in A. Scale bar: 5 µm.
Fig. 3.
Fig. 3.
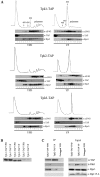
Tpk2 and Tpk3 are associated in vivo with translation initiation complexes during exponential growth. (A) Polysomal profile analysis and immunoblots of 15–50% sucrose gradient fractions from cells expressing Tpk1-TAP (top), Tpk2-TAP (middle) or Tpk3-TAP (bottom) grown to exponential phase in YPD and subjected to glucose starvation for 20 minutes (YP). (B) Expression levels of each Tpk under exponential growth (YPD) or after glucose starvation (YP) were determined by immunoblot. The abundance of each Tpk represents 5% of the input fraction used in A. (C) Tpk2-TAP and untagged strains were purified from 20-minute glucose-starved (YP) or unstarved (YPD) cultures. Immunoprecipitated samples were subjected to western blot analysis with anti-TAP, anti-Pab1, anti-Rps3 and anti-Rpl35A antibodies. The input represents 1% of total protein used in the immunoprecipitation assay.
Fig. 4.
Fig. 4.
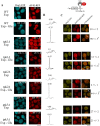
TPK3 deletion promotes aberrant granule accumulation during exponential phase. (A) WT, tpk1Δ, tpk2Δ or tpk3Δ cells coexpressing Dcp2–CFP and eIF4E–RFP, grown to exponential phase (Exp) and subjected to glucose starvation (Exp-Glu) for 20 minutes were visualized by fluorescence microscopy. The number in each image indicates the total number of Dcp2–CFP- or eIF4E–RFP-containing granules per 100 cells. Scale bar: 5 µm. (B) Polysomal profiles of the strains shown in A. The numbers represent the polysome/monosome area. (C) WT, tpk1Δ, tpk2Δ or tpk3Δ cells coexpressing Dcp2–YFP and ENO2-MS2–RFP mRNA were incubated as described in A. The numbers are the number of Dcp2–YFP granules containing ENO2-MS2–RFP mRNA/100 cells. The arrows indicate granules containing both Dcp2–YFP and ENO2-MS2–RFP. Scale bar: 5 µm. Values are mean ± s.d. (n = 5). *P<0.001 Exp versus Exp-Glu.
Fig. 5.
Fig. 5.
Biochemical characterization of granules from Tpk mutant cells. WT or tpk3Δ strains were (A) grown to exponential phase (Exp) and then subjected to glucose starvation for 20 minutes (Exp-Glu 20 min) or (B) grown to stationary phase (SP) and re-fed with YPD for 10 minutes (SP+YPD). Immunoblots from granule-enriched fractions (P) and their corresponding supernatants (S). The graphs represent the relative abundance for each protein between the P and S fractions, determined by densitometric quantification of the bands. (C) P fractions from a WT strain after glucose starvation or tpk3Δ strain grown to exponential phase in the absence (−) or presence (+) of RNase A.
Fig. 6.
Fig. 6.
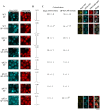
PKA catalytic subunits are required for proper accumulation of PBs and SGs during stationary phase. (A) WT, tpk1Δ, tpk2Δ or tpk3Δ cells coexpressing Dcp2–CFP and eIF4E–RFP were grown to stationary phase (SP), refed with YPD (SP+YPD) for 10 minutes and visualized by fluorescence microscopy. The inset number in each picture indicates the total number of Dcp2–CFP or eIF4E–RFP/100 cells. (B) Polysomal profiles of the strains shown in A. Numbers represent the polysome/monosome area. (C) Cells coexpressing Dcp2–YFP, eIF4E–CFP and ENO2-MS2–RFP mRNA were incubated as described in A. Data are the number of Dcp2–YFP or eIF4E–CFP granules containing ENO2-MS2–RFP mRNA/100 cells. Values are mean ± s.d. n = 5). *P<0.0001 and #P<0.0001, SP versus SP+YPD. Scale bar: 5 µm.
Fig. 7.
Fig. 7.
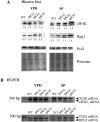
PKA regulates Rpg1 and eIF4G1 expression levels during stationary phase. (A) WT, tpk1Δ, tpk2Δ or tpk3Δ strains were grown to exponential (left panel) or stationary (right panel) phase in YPD. Endogenous expression levels of eIF4G1, Rpg1 and Pyk1 (control) were analysed by western blotting. The numbers under blots are the densitometric quantification of Rpg1 or eIF4G1 bands in relation with Pyk bands. (B) RT-PCR of eIF4G1 (TIF4631), RPG1 and TUB1 (control) mRNA during exponential (YPD) and stationary (SP) phase.
Fig. 8.
Fig. 8.
Tpk3 controls translation activation dynamics. WT, tpk1Δ, tpk2Δ and tpk3Δ polysome profiles were analysed by sucrose gradient sedimentation at the different times points indicated in the figure. (A) Cells were grown to exponential phase in YPD, subjected to glucose starvation (YP) and re-fed with YPD. (B) Cells were grown to stationary phase and re-fed with YPD. The graphs show the polysome/monosome area ratio along the time course. Values are means ± s.d., n = 2. Representative polysome profiles of the times indicated are shown.

Similar articles

Cited by

References

    1. Anderson P., Kedersha N. (2006). RNA granules. J. Cell Biol. 172, 803–808 10.1083/jcb.200512082 - DOI - PMC - PubMed
    1. Ashe M. P., De Long S. K., Sachs A. B. (2000). Glucose depletion rapidly inhibits translation initiation in yeast. Mol. Biol. Cell 11, 833–848 - PMC - PubMed
    1. Berset C., Trachsel H., Altmann M. (1998). The TOR (target of rapamycin) signal transduction pathway regulates the stability of translation initiation factor eIF4G in the yeast Saccharomyces cerevisiae. Proc. Natl. Acad. Sci. USA 95, 4264–4269 10.1073/pnas.95.8.4264 - DOI - PMC - PubMed
    1. Beullens M., Mbonyi K., Geerts L., Gladines D., Detremerie K., Jans A. W., Thevelein J. M. (1988). Studies on the mechanism of the glucose-induced cAMP signal in glycolysis and glucose repression mutants of the yeast Saccharomyces cerevisiae. Eur. J. Biochem. 172, 227–231 10.1111/j.1432-1033.1988.tb13877.x - DOI - PubMed
    1. Braun J. E., Tritschler F., Haas G., Igreja C., Truffault V., Weichenrieder O., Izaurralde E. (2010). The C-terminal alpha-alpha superhelix of Pat is required for mRNA decapping in metazoa. EMBO J. 29, 2368–2380 10.1038/emboj.2010.124 - DOI - PMC - PubMed

Publication types

MeSH terms

Substances