Discovery and structure activity relationship of small molecule inhibitors of toxic β-amyloid-42 fibril formation
- PMID: 22891248
- PMCID: PMC3464581
- DOI: 10.1074/jbc.M112.357665
Discovery and structure activity relationship of small molecule inhibitors of toxic β-amyloid-42 fibril formation
Abstract
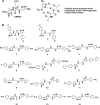
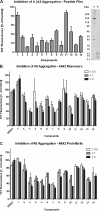
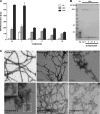
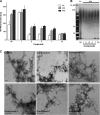
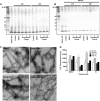
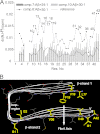
Increasing evidence implicates Aβ peptides self-assembly and fibril formation as crucial events in the pathogenesis of Alzheimer disease. Thus, inhibiting Aβ aggregation, among others, has emerged as a potential therapeutic intervention for this disorder. Herein, we employed 3-aminopyrazole as a key fragment in our design of non-dye compounds capable of interacting with Aβ42 via a donor-acceptor-donor hydrogen bond pattern complementary to that of the β-sheet conformation of Aβ42. The initial design of the compounds was based on connecting two 3-aminopyrazole moieties via a linker to identify suitable scaffold molecules. Additional aryl substitutions on the two 3-aminopyrazole moieties were also explored to enhance π-π stacking/hydrophobic interactions with amino acids of Aβ42. The efficacy of these compounds on inhibiting Aβ fibril formation and toxicity in vitro was assessed using a combination of biophysical techniques and viability assays. Using structure activity relationship data from the in vitro assays, we identified compounds capable of preventing pathological self-assembly of Aβ42 leading to decreased cell toxicity.
Figures




Similar articles
-
Scrutiny of the mechanism of small molecule inhibitor preventing conformational transition of amyloid-β42 monomer: insights from molecular dynamics simulations.J Biomol Struct Dyn. 2018 Feb;36(3):663-678. doi: 10.1080/07391102.2017.1291363. Epub 2017 Feb 28. J Biomol Struct Dyn. 2018. PMID: 28162045
-
Identification of a Novel Multifunctional Ligand for Simultaneous Inhibition of Amyloid-Beta (Aβ42) and Chelation of Zinc Metal Ion.ACS Chem Neurosci. 2019 Nov 20;10(11):4619-4632. doi: 10.1021/acschemneuro.9b00468. Epub 2019 Oct 10. ACS Chem Neurosci. 2019. PMID: 31566950
-
Prevention of Alzheimer's disease-associated Abeta aggregation by rationally designed nonpeptidic beta-sheet ligands.J Biol Chem. 2004 Nov 12;279(46):47497-505. doi: 10.1074/jbc.M405914200. Epub 2004 Aug 20. J Biol Chem. 2004. PMID: 15322133
-
Understanding amyloid fibril nucleation and aβ oligomer/drug interactions from computer simulations.Acc Chem Res. 2014 Feb 18;47(2):603-11. doi: 10.1021/ar4002075. Epub 2013 Dec 24. Acc Chem Res. 2014. PMID: 24368046 Review.
-
Modulation of Amyloid β-Protein (Aβ) Assembly by Homologous C-Terminal Fragments as a Strategy for Inhibiting Aβ Toxicity.ACS Chem Neurosci. 2016 Jul 20;7(7):845-56. doi: 10.1021/acschemneuro.6b00154. Epub 2016 Jul 5. ACS Chem Neurosci. 2016. PMID: 27322435 Free PMC article. Review.
Cited by
-
Umbelliferyloxymethyl phosphonate compounds-weakly binding zinc ionophores with neuroprotective properties.Dalton Trans. 2021 Nov 30;50(46):17041-17051. doi: 10.1039/d1dt02298a. Dalton Trans. 2021. PMID: 34761777 Free PMC article.
-
Short-term treatment with tolfenamic acid improves cognitive functions in Alzheimer's disease mice.Neurobiol Aging. 2013 Oct;34(10):2421-30. doi: 10.1016/j.neurobiolaging.2013.04.002. Epub 2013 Apr 30. Neurobiol Aging. 2013. PMID: 23639209 Free PMC article.
-
High-Throughput Screening at the Membrane Interface Reveals Inhibitors of Amyloid-β.Biochemistry. 2020 Jun 23;59(24):2249-2258. doi: 10.1021/acs.biochem.0c00328. Epub 2020 Jun 5. Biochemistry. 2020. PMID: 32469202 Free PMC article.
-
A catalytic antioxidant for limiting amyloid-beta peptide aggregation and reactive oxygen species generation.Chem Sci. 2018 Dec 3;10(6):1634-1643. doi: 10.1039/c8sc04660c. eCollection 2019 Feb 14. Chem Sci. 2018. PMID: 30842826 Free PMC article.
-
Inhibiting β-amyloid-associated Alzheimer's pathogenesis in vitro and in vivo by a multifunctional dimeric bis(12)-hupyridone derived from its natural analogue.J Mol Neurosci. 2015 Apr;55(4):1014-21. doi: 10.1007/s12031-014-0458-5. Epub 2014 Nov 19. J Mol Neurosci. 2015. PMID: 25407821
References
-
- LaFerla F. M., Green K. N., Oddo S. (2007) Intracellular amyloid-β in Alzheimer disease. Nat. Rev. Neurosci. 8, 499–509 - PubMed
-
- Smith M. A. (1998) Alzheimer disease. Int. Rev. Neurobiol. 42, 1–54 - PubMed
-
- Clark C. M., Karlawish J. H. (2003) Alzheimer disease. Current concepts and emerging diagnostic and therapeutic strategies. Ann. Intern. Med. 138, 400–410 - PubMed
-
- Cummings J. L. (2004) Alzheimer disease. N. Engl. J. Med. 351, 56–67 - PubMed
-
- Grundman M., Thal L. J. (2000) Treatment of Alzheimer disease. Rationale and strategies. Neurol. Clin. 18, 807–828 - PubMed
Publication types
MeSH terms
Substances
LinkOut - more resources
Full Text Sources
Other Literature Sources
Research Materials
Miscellaneous

