Irradiation promotes an m2 macrophage phenotype in tumor hypoxia
- PMID: 22888475
- PMCID: PMC3412458
- DOI: 10.3389/fonc.2012.00089
Irradiation promotes an m2 macrophage phenotype in tumor hypoxia
Abstract
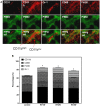
Macrophages display different phenotypes with distinct functions and can rapidly respond to environmental changes. Previous studies on TRAMP-C1 tumor model have shown that irradiation has a strong impact on tumor microenvironments. The major changes include the decrease of microvascular density, the increase of avascular hypoxia, and the aggregation of tumor-associated macrophages in avascular hypoxic regions. Similar changes were observed no matter the irradiation was given to tissue bed before tumor implantation (pre-IR tumors), or to established tumors (IR tumors). Recent results on three murine tumors, TRAMP-C1 prostate adenocarcinoma, ALTS1C1 astrocytoma, and GL261 glioma, further demonstrate that different phenotypes of inflammatory cells are spatially distributed into different microenvironments in both IR and pre-IR tumors. Regions with avascular hypoxia and central necrosis have CD11b(high)/Gr-1+ neutrophils in the center of the necrotic area. Next to them are CD11b(low)/F4/80+ macrophages that sit at the junctions between central necrotic and surrounding hypoxic regions. The majority of cells in the hypoxic regions are CD11b(low)/CD68+ macrophages. These inflammatory cell populations express different levels of Arg I. This distribution pattern, except for neutrophils, is not observed in tumors receiving chemotherapy or an anti-angiogenesis agent which also lead to avascular hypoxia. This unique distribution pattern of inflammatory cells in IR tumor sites is interfered with by targeting the expression of a chemokine protein, SDF-1α, by tumor cells, and this also increases radiation-induced tumor growth delay. This indicates that irradiated-hypoxia tissues have distinct tumor microenvironments that favor the development of M2 macrophages and that is affected by the levels of tumor-secreted SDF-1α.
Keywords: radiation; tumor microenvironment; tumor-associated macrophages.
Figures


Similar articles
-
Radiotherapy decreases vascular density and causes hypoxia with macrophage aggregation in TRAMP-C1 prostate tumors.Clin Cancer Res. 2009 Mar 1;15(5):1721-9. doi: 10.1158/1078-0432.CCR-08-1471. Epub 2009 Feb 24. Clin Cancer Res. 2009. PMID: 19240176 Free PMC article.
-
Tumor-secreted SDF-1 promotes glioma invasiveness and TAM tropism toward hypoxia in a murine astrocytoma model.Lab Invest. 2012 Jan;92(1):151-62. doi: 10.1038/labinvest.2011.128. Epub 2011 Sep 5. Lab Invest. 2012. PMID: 21894147
-
Role of Myeloid-Derived Suppressor Cells in High-Dose-Irradiated TRAMP-C1 Tumors: A Therapeutic Target and an Index for Assessing Tumor Microenvironment.Int J Radiat Oncol Biol Phys. 2021 Apr 1;109(5):1547-1558. doi: 10.1016/j.ijrobp.2020.11.004. Epub 2020 Nov 12. Int J Radiat Oncol Biol Phys. 2021. PMID: 33188861
-
Monocytes and dendritic cells in a hypoxic environment: Spotlights on chemotaxis and migration.Immunobiology. 2008;213(9-10):733-49. doi: 10.1016/j.imbio.2008.07.031. Epub 2008 Sep 21. Immunobiology. 2008. PMID: 18926289 Review.
-
Mechanisms regulating the recruitment of macrophages into hypoxic areas of tumors and other ischemic tissues.Blood. 2004 Oct 15;104(8):2224-34. doi: 10.1182/blood-2004-03-1109. Epub 2004 Jul 1. Blood. 2004. PMID: 15231578 Review.
Cited by
-
Combining radiotherapy and cancer immunotherapy: a paradigm shift.J Natl Cancer Inst. 2013 Feb 20;105(4):256-65. doi: 10.1093/jnci/djs629. Epub 2013 Jan 4. J Natl Cancer Inst. 2013. PMID: 23291374 Free PMC article. Review.
-
Ablative Radiotherapy Reprograms the Tumor Microenvironment of a Pancreatic Tumor in Favoring the Immune Checkpoint Blockade Therapy.Int J Mol Sci. 2021 Feb 19;22(4):2091. doi: 10.3390/ijms22042091. Int J Mol Sci. 2021. PMID: 33669885 Free PMC article.
-
FGF2 alters macrophage polarization, tumour immunity and growth and can be targeted during radiotherapy.Nat Commun. 2020 Aug 13;11(1):4064. doi: 10.1038/s41467-020-17914-x. Nat Commun. 2020. PMID: 32792542 Free PMC article.
-
Pivotal Role of Cranial Irradiation-Induced Peripheral, Intrinsic, and Brain-Engrafting Macrophages in Malignant Glioma.Clin Med Insights Oncol. 2024 Oct 12;18:11795549241282098. doi: 10.1177/11795549241282098. eCollection 2024. Clin Med Insights Oncol. 2024. PMID: 39421649 Free PMC article. Review.
-
A preliminary Study on the Effect of Head and Neck Chemoradiotherapy on Systematic Immunity.Dose Response. 2019 Oct 28;17(4):1559325819884186. doi: 10.1177/1559325819884186. eCollection 2019 Oct-Dec. Dose Response. 2019. PMID: 31695581 Free PMC article.
References
LinkOut - more resources
Full Text Sources
Other Literature Sources
Research Materials

