Harnessing the PI3K/Akt/mTOR pathway in T-cell acute lymphoblastic leukemia: eliminating activity by targeting at different levels
- PMID: 22885370
- PMCID: PMC3478458
- DOI: 10.18632/oncotarget.579
Harnessing the PI3K/Akt/mTOR pathway in T-cell acute lymphoblastic leukemia: eliminating activity by targeting at different levels
Abstract
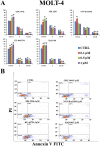
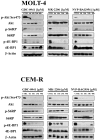
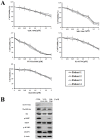
T-cell acute lymphoblastic leukemia (T-ALL) is an aggressive malignant hematological disorder arising in the thymus from T-cell progenitors. T-ALL mainly affects children and young adults, and remains fatal in 20% of adolescents and 50% of adults, despite progress in polychemotherapy protocols. Therefore, innovative targeted therapies are desperately needed for patients with a dismal prognosis. Aberrant activation of PI3K/Akt/mTOR signaling is a common event in T-ALL patients and portends a poor prognosis. Preclinical studies have highlighted that modulators of PI3K/Akt/mTOR signaling could have a therapeutic relevance in T-ALL. However, the best strategy for inhibiting this highly complex signal transduction pathway is still unclear, as the pharmaceutical companies have disclosed an impressive array of small molecules targeting this signaling network at different levels. Here, we demonstrate that a dual PI3K/PDK1 inhibitor, NVP-BAG956, displayed the most powerful cytotoxic affects against T-ALL cell lines and primary patients samples, when compared with a pan class I PI3K inhibitor (GDC-0941), an allosteric Akt inhibitor (MK-2206), an mTORC1 allosteric inhibitor (RAD-001), or an ATP-competitive mTORC1/mTORC2 inhibitor (KU63794). Moreover, we also document that combinations of some of the aforementioned drugs strongly synergized against T-ALL cells at concentrations well below their respective IC50. This observation indicates that vertical inhibition at different levels of the PI3K/Akt/mTOR network could be considered as a future innovative strategy for treating T-ALL patients.
Figures


Similar articles
-
Differential effects of selective inhibitors targeting the PI3K/AKT/mTOR pathway in acute lymphoblastic leukemia.PLoS One. 2013 Nov 14;8(11):e80070. doi: 10.1371/journal.pone.0080070. eCollection 2013. PLoS One. 2013. PMID: 24244612 Free PMC article.
-
Synergistic effects of selective inhibitors targeting the PI3K/AKT/mTOR pathway or NUP214-ABL1 fusion protein in human Acute Lymphoblastic Leukemia.Oncotarget. 2016 Nov 29;7(48):79842-79853. doi: 10.18632/oncotarget.13035. Oncotarget. 2016. PMID: 27821800 Free PMC article.
-
Dual inhibition of class IA phosphatidylinositol 3-kinase and mammalian target of rapamycin as a new therapeutic option for T-cell acute lymphoblastic leukemia.Cancer Res. 2009 Apr 15;69(8):3520-8. doi: 10.1158/0008-5472.CAN-08-4884. Epub 2009 Apr 7. Cancer Res. 2009. PMID: 19351820 Free PMC article.
-
Targeting the PI3K/AKT/mTOR signaling axis in children with hematologic malignancies.Paediatr Drugs. 2012 Oct 1;14(5):299-316. doi: 10.2165/11594740-000000000-00000. Paediatr Drugs. 2012. PMID: 22845486 Free PMC article. Review.
-
Targeting signaling pathways in T-cell acute lymphoblastic leukemia initiating cells.Adv Biol Regul. 2014 Sep;56:6-21. doi: 10.1016/j.jbior.2014.04.004. Epub 2014 Apr 30. Adv Biol Regul. 2014. PMID: 24819383 Review.
Cited by
-
Comprehensive analysis of T cell leukemia signals reveals heterogeneity in the PI3 kinase-Akt pathway and limitations of PI3 kinase inhibitors as monotherapy.PLoS One. 2018 May 25;13(5):e0193849. doi: 10.1371/journal.pone.0193849. eCollection 2018. PLoS One. 2018. PMID: 29799846 Free PMC article.
-
Novel Therapeutic Strategies in Acute Lymphoblastic Leukemia.Curr Hematol Malig Rep. 2016 Aug;11(4):253-64. doi: 10.1007/s11899-016-0326-1. Curr Hematol Malig Rep. 2016. PMID: 27101015 Review.
-
Expression of the miR-150 tumor suppressor is restored by and synergizes with rapamycin in a human leukemia T-cell line.Leuk Res. 2018 Nov;74:1-9. doi: 10.1016/j.leukres.2018.09.009. Epub 2018 Sep 22. Leuk Res. 2018. PMID: 30269036 Free PMC article.
-
Overcoming Steroid Resistance in Pediatric Acute Lymphoblastic Leukemia-The State-of-the-Art Knowledge and Future Prospects.Int J Mol Sci. 2022 Mar 30;23(7):3795. doi: 10.3390/ijms23073795. Int J Mol Sci. 2022. PMID: 35409154 Free PMC article. Review.
-
Immunosuppressants in cancer prevention and therapy.Oncoimmunology. 2013 Dec 1;2(12):e26961. doi: 10.4161/onci.26961. Epub 2013 Nov 6. Oncoimmunology. 2013. PMID: 24575379 Free PMC article. Review.
References
-
- Demarest RM, Ratti F, Capobianco AJ. It's T-ALL about Notch. Oncogene. 2008;27:5082–5091. - PubMed
-
- Pui CH, Robison LL, Look AT. Acute lymphoblastic leukaemia. Lancet. 2008;371:1030–1043. - PubMed
-
- Dancey JE, Bedard PL, Onetto N, Hudson TJ. The genetic basis for cancer treatment decisions. Cell. 2012;148:409–420. - PubMed
-
- Kraszewska MD, Dawidowska M, Szczepanski T, Witt M. T-cell acute lymphoblastic leukaemia: Recent molecular biology findings. Br J Haematol. 2012;156:303–315. - PubMed
-
- Kelloff GJ, Sigman CC. Cancer biomarkers: Selecting the right drug for the right patient. Nat Rev Drug Discov. 2012;11:201–214. - PubMed
Publication types
MeSH terms
Substances
LinkOut - more resources
Full Text Sources
Other Literature Sources
Miscellaneous

