

The locus coeruleus-norepinephrine network optimizes coupling of cerebral blood volume with oxygen demand
- PMID: 22872230
- PMCID: PMC3519408
- DOI: 10.1038/jcbfm.2012.115
The locus coeruleus-norepinephrine network optimizes coupling of cerebral blood volume with oxygen demand
Abstract
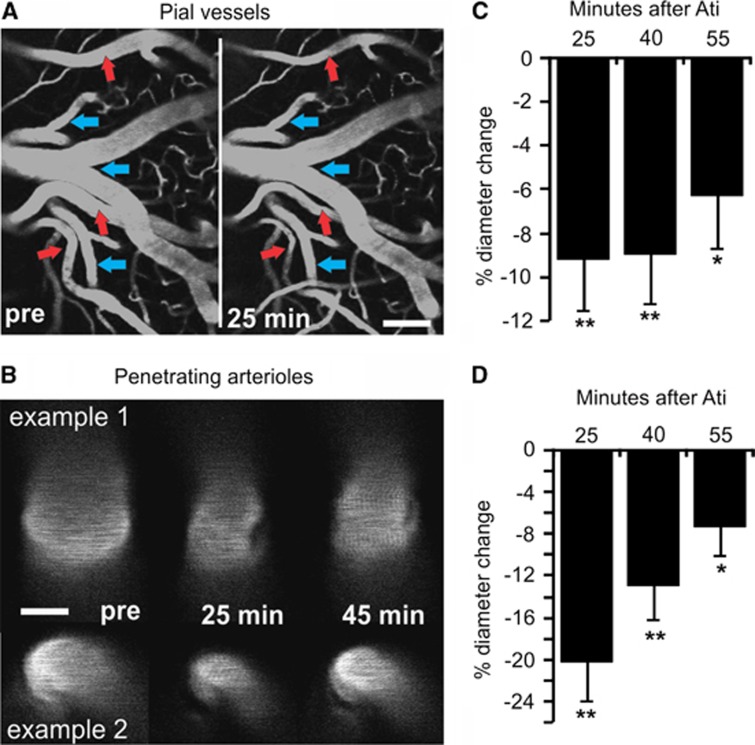
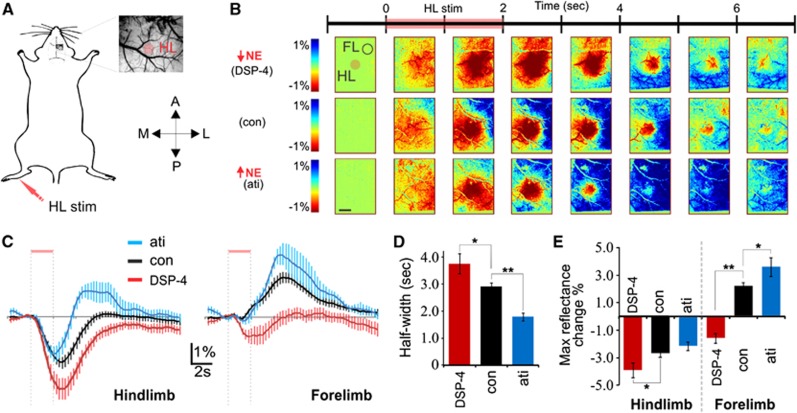
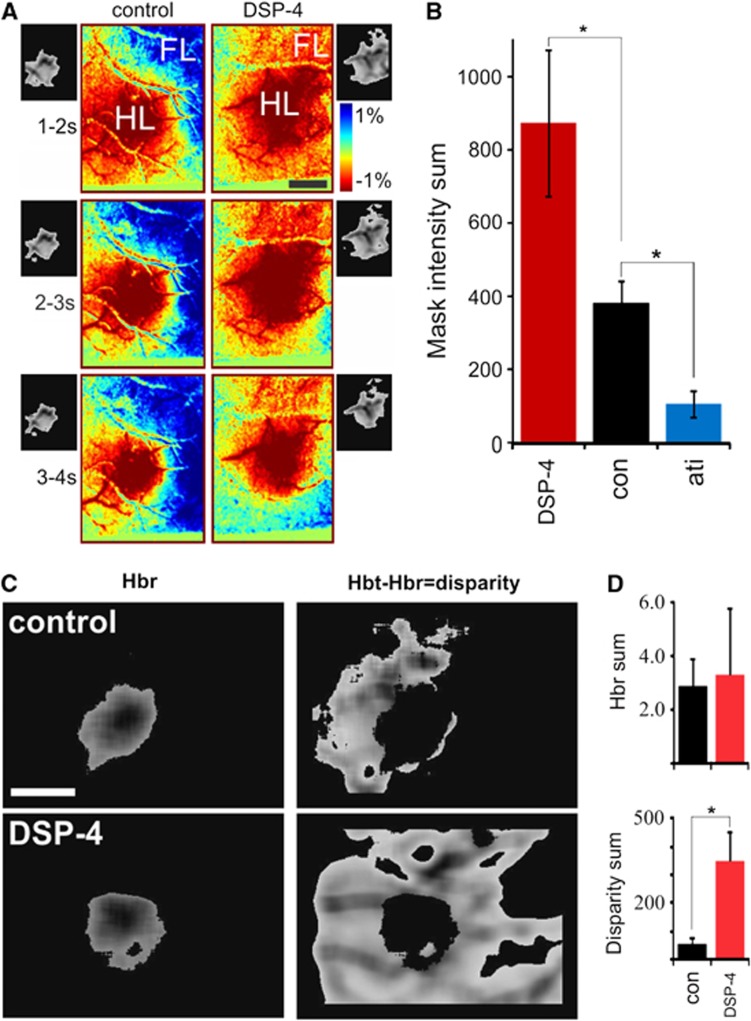
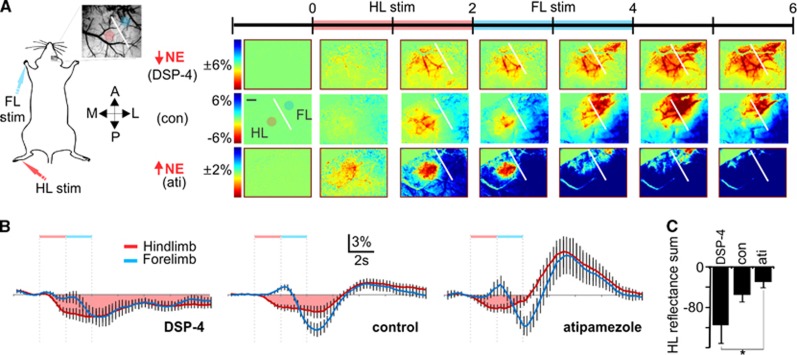
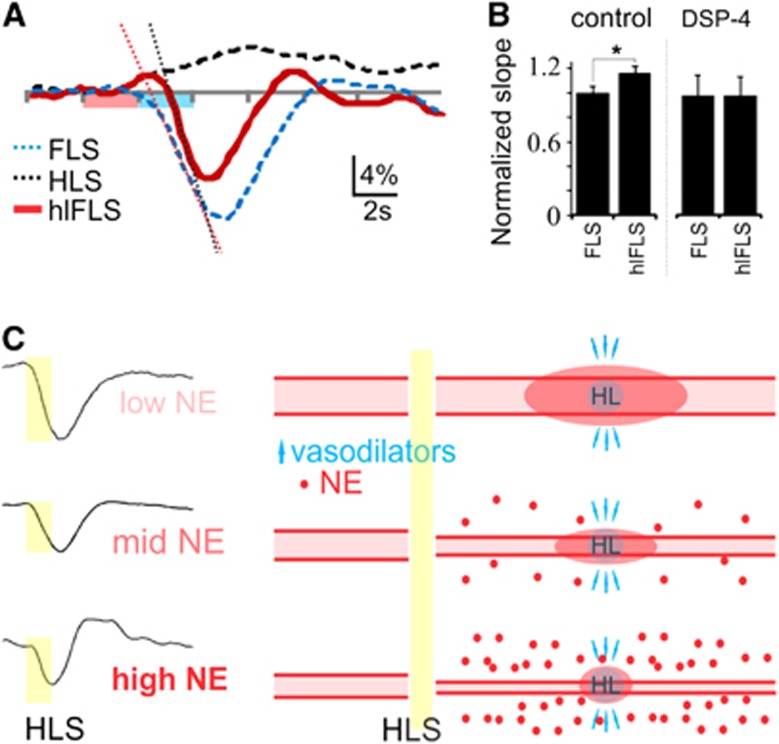
Given the brain's uniquely high cell density and tissue oxygen levels bordering on hypoxia, the ability to rapidly and precisely match blood flow to constantly changing patterns in neural activity is an essential feature of cerebrovascular regulation. Locus coeruleus-norepinephrine (LC-NE) projections innervate the cerebral vasculature and can mediate vasoconstriction. However, function of the LC-mediated constriction in blood-flow regulation has never been addressed. Here, using intrinsic optical imaging coupled with an anesthesia regimen that only minimally interferes with LC activity, we show that NE enhances spatial and temporal aspects of functional hyperemia in the mouse somatosensory cortex. Increasing NE levels in the cortex using an α(2)-adrenergic receptor antagonist paradoxically reduces the extent of functional hyperemia while enhancing the surround blood-flow reduction. However, the NE-mediated vasoconstriction optimizes spatial and temporal focusing of the hyperemic response resulting in a sixfold decrease in the disparity between blood volume and oxygen demand. In addition, NE-mediated vasoconstriction accelerated redistribution to subsequently active regions, enhancing temporal synchronization of blood delivery. These observations show an important role for NE in optimizing neurovascular coupling. As LC neuron loss is prominent in Alzheimer and Parkinson diseases, the diminished ability to couple blood volume to oxygen demand may contribute to their pathogenesis.
Figures
Similar articles
-
Inflow of oxygen and glucose in brain tissue induced by intravenous norepinephrine: relationships with central metabolic and peripheral vascular responses.J Neurophysiol. 2018 Feb 1;119(2):499-508. doi: 10.1152/jn.00692.2017. Epub 2017 Nov 8. J Neurophysiol. 2018. PMID: 29118201 Free PMC article.
-
Enhanced Retrieval of Taste Associative Memory by Chemogenetic Activation of Locus Coeruleus Norepinephrine Neurons.J Neurosci. 2020 Oct 21;40(43):8367-8385. doi: 10.1523/JNEUROSCI.1720-20.2020. Epub 2020 Sep 29. J Neurosci. 2020. PMID: 32994339 Free PMC article.
-
Role of Noradrenergic Brain Nuclei in the Regulation of Carotid Artery Blood Flow: Pharmacological Evidence from Anesthetized Pigs with Alpha-2 Adrenergic Receptor Modulator Drugs.J Alzheimers Dis. 2018;66(1):407-419. doi: 10.3233/JAD-180340. J Alzheimers Dis. 2018. PMID: 30248055
-
Locus coeruleus.Cell Tissue Res. 2018 Jul;373(1):221-232. doi: 10.1007/s00441-017-2649-1. Epub 2017 Jul 7. Cell Tissue Res. 2018. PMID: 28687925 Review.
-
Consequences of tuning network function by tonic and phasic locus coeruleus output and stress: Regulating detection and discrimination of peripheral stimuli.Brain Res. 2019 Apr 15;1709:16-27. doi: 10.1016/j.brainres.2018.06.015. Epub 2018 Jun 13. Brain Res. 2019. PMID: 29908165 Review.
Cited by
-
Rapid Postnatal Expansion of Neural Networks Occurs in an Environment of Altered Neurovascular and Neurometabolic Coupling.J Neurosci. 2016 Jun 22;36(25):6704-17. doi: 10.1523/JNEUROSCI.2363-15.2016. J Neurosci. 2016. PMID: 27335402 Free PMC article.
-
Resolving the transition from negative to positive blood oxygen level-dependent responses in the developing brain.Proc Natl Acad Sci U S A. 2013 Mar 12;110(11):4380-5. doi: 10.1073/pnas.1212785110. Epub 2013 Feb 20. Proc Natl Acad Sci U S A. 2013. PMID: 23426630 Free PMC article.
-
Cellular Control of Brain Capillary Blood Flow: In Vivo Imaging Veritas.Trends Neurosci. 2019 Aug;42(8):528-536. doi: 10.1016/j.tins.2019.05.009. Epub 2019 Jun 26. Trends Neurosci. 2019. PMID: 31255380 Free PMC article. Review.
-
Neurodegeneration in Parkinson's disease: interactions of oxidative stress, tryptophan catabolites and depression with mitochondria and sirtuins.Mol Neurobiol. 2014 Apr;49(2):771-83. doi: 10.1007/s12035-013-8554-z. Epub 2013 Oct 2. Mol Neurobiol. 2014. PMID: 24085563 Review.
-
Spontaneous BOLD waves - A novel hemodynamic activity in Sprague-Dawley rat brain detected by functional magnetic resonance imaging.J Cereb Blood Flow Metab. 2019 Oct;39(10):1949-1960. doi: 10.1177/0271678X18772994. Epub 2018 Apr 25. J Cereb Blood Flow Metab. 2019. PMID: 29690796 Free PMC article.
References
-
- Berridge CW, Waterhouse BD. The locus coeruleus-noradrenergic system: modulation of behavioral state and state-dependent cognitive processes. Brain Res Brain Res Rev. 2003;42:33–84. - PubMed
Publication types
MeSH terms
Substances
Grants and funding
LinkOut - more resources
Full Text Sources
Research Materials
