Exercise alleviates lipid-induced insulin resistance in human skeletal muscle-signaling interaction at the level of TBC1 domain family member 4
- PMID: 22851577
- PMCID: PMC3478539
- DOI: 10.2337/db11-1572
Exercise alleviates lipid-induced insulin resistance in human skeletal muscle-signaling interaction at the level of TBC1 domain family member 4
Abstract
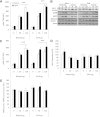
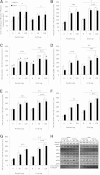
Excess lipid availability causes insulin resistance. We examined the effect of acute exercise on lipid-induced insulin resistance and TBC1 domain family member 1/4 (TBCD1/4)-related signaling in skeletal muscle. In eight healthy young male subjects, 1 h of one-legged knee-extensor exercise was followed by 7 h of saline or intralipid infusion. During the last 2 h, a hyperinsulinemic-euglycemic clamp was performed. Femoral catheterization and analysis of biopsy specimens enabled measurements of leg substrate balance and muscle signaling. Each subject underwent two experimental trials, differing only by saline or intralipid infusion. Glucose infusion rate and leg glucose uptake was decreased by intralipid. Insulin-stimulated glucose uptake was higher in the prior exercised leg in the saline and the lipid trials. In the lipid trial, prior exercise normalized insulin-stimulated glucose uptake to the level observed in the resting control leg in the saline trial. Insulin increased phosphorylation of TBC1D1/4. Whereas prior exercise enhanced TBC1D4 phosphorylation on all investigated sites compared with the rested leg, intralipid impaired TBC1D4 S341 phosphorylation compared with the control trial. Intralipid enhanced pyruvate dehydrogenase (PDH) phosphorylation and lactate release. Prior exercise led to higher PDH phosphorylation and activation of glycogen synthase compared with resting control. In conclusion, lipid-induced insulin resistance in skeletal muscle was associated with impaired TBC1D4 S341 and elevated PDH phosphorylation. The prophylactic effect of exercise on lipid-induced insulin resistance may involve augmented TBC1D4 signaling and glycogen synthase activation.
Figures


Similar articles
-
Roles of TBC1D1 and TBC1D4 in insulin- and exercise-stimulated glucose transport of skeletal muscle.Diabetologia. 2015 Jan;58(1):19-30. doi: 10.1007/s00125-014-3395-5. Epub 2014 Oct 4. Diabetologia. 2015. PMID: 25280670 Free PMC article. Review.
-
Exercise Increases Human Skeletal Muscle Insulin Sensitivity via Coordinated Increases in Microvascular Perfusion and Molecular Signaling.Diabetes. 2017 Jun;66(6):1501-1510. doi: 10.2337/db16-1327. Epub 2017 Mar 14. Diabetes. 2017. PMID: 28292969
-
Lipid-induced insulin resistance affects women less than men and is not accompanied by inflammation or impaired proximal insulin signaling.Diabetes. 2011 Jan;60(1):64-73. doi: 10.2337/db10-0698. Epub 2010 Oct 18. Diabetes. 2011. PMID: 20956497 Free PMC article.
-
Pharmacological Activation of PDC Flux Reverses Lipid-Induced Inhibition of Insulin Action in Muscle During Recovery From Exercise.Diabetes. 2024 Jul 1;73(7):1072-1083. doi: 10.2337/db23-0879. Diabetes. 2024. PMID: 38608261
-
Studies of gene expression and activity of hexokinase, phosphofructokinase and glycogen synthase in human skeletal muscle in states of altered insulin-stimulated glucose metabolism.Dan Med Bull. 1999 Feb;46(1):13-34. Dan Med Bull. 1999. PMID: 10081651 Review.
Cited by
-
Effects of a brief high-fat diet and acute exercise on the mTORC1 and IKK/NF-κB pathways in rat skeletal muscle.Appl Physiol Nutr Metab. 2015 Mar;40(3):251-62. doi: 10.1139/apnm-2014-0412. Epub 2014 Nov 17. Appl Physiol Nutr Metab. 2015. PMID: 25706655 Free PMC article.
-
Postexercise improvement in glucose uptake occurs concomitant with greater γ3-AMPK activation and AS160 phosphorylation in rat skeletal muscle.Am J Physiol Endocrinol Metab. 2018 Nov 1;315(5):E859-E871. doi: 10.1152/ajpendo.00020.2018. Epub 2018 Aug 21. Am J Physiol Endocrinol Metab. 2018. PMID: 30130149 Free PMC article.
-
Exercise-Induced Improvement in Insulin-Stimulated Glucose Uptake by Rat Skeletal Muscle Is Absent in Male AS160-Knockout Rats, Partially Restored by Muscle Expression of Phosphomutated AS160, and Fully Restored by Muscle Expression of Wild-Type AS160.Diabetes. 2022 Feb 1;71(2):219-232. doi: 10.2337/db21-0601. Diabetes. 2022. PMID: 34753801 Free PMC article.
-
Roles of TBC1D1 and TBC1D4 in insulin- and exercise-stimulated glucose transport of skeletal muscle.Diabetologia. 2015 Jan;58(1):19-30. doi: 10.1007/s00125-014-3395-5. Epub 2014 Oct 4. Diabetologia. 2015. PMID: 25280670 Free PMC article. Review.
-
Microtubule-mediated GLUT4 trafficking is disrupted in insulin-resistant skeletal muscle.Elife. 2023 Apr 19;12:e83338. doi: 10.7554/eLife.83338. Elife. 2023. PMID: 37073948 Free PMC article.
References
-
- Boden G, Lebed B, Schatz M, Homko C, Lemieux S. Effects of acute changes of plasma free fatty acids on intramyocellular fat content and insulin resistance in healthy subjects. Diabetes 2001;50:1612–1617 - PubMed
-
- Itani SI, Ruderman NB, Schmieder F, Boden G. Lipid-induced insulin resistance in human muscle is associated with changes in diacylglycerol, protein kinase C, and IkappaB-alpha. Diabetes 2002;51:2005–2011 - PubMed
-
- Chavez JA, Summers SA. Characterizing the effects of saturated fatty acids on insulin signaling and ceramide and diacylglycerol accumulation in 3T3-L1 adipocytes and C2C12 myotubes. Arch Biochem Biophys 2003;419:101–109 - PubMed
-
- Itani SI, Zhou Q, Pories WJ, MacDonald KG, Dohm GL. Involvement of protein kinase C in human skeletal muscle insulin resistance and obesity. Diabetes 2000;49:1353–1358 - PubMed
Publication types
MeSH terms
Substances
Grants and funding
LinkOut - more resources
Full Text Sources
Medical
Molecular Biology Databases

