Finding a needle in a haystack: the role of electrostatics in target lipid recognition by PH domains
- PMID: 22844242
- PMCID: PMC3406000
- DOI: 10.1371/journal.pcbi.1002617
Finding a needle in a haystack: the role of electrostatics in target lipid recognition by PH domains
Abstract
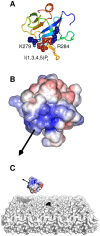
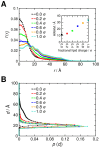
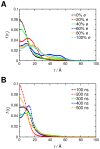
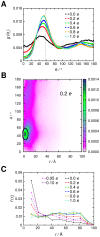
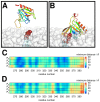
Interactions between protein domains and lipid molecules play key roles in controlling cell membrane signalling and trafficking. The pleckstrin homology (PH) domain is one of the most widespread, binding specifically to phosphatidylinositol phosphates (PIPs) in cell membranes. PH domains must locate specific PIPs in the presence of a background of approximately 20% anionic lipids within the cytoplasmic leaflet of the plasma membrane. We investigate the mechanism of such recognition via a multiscale procedure combining Brownian dynamics (BD) and molecular dynamics (MD) simulations of the GRP1 PH domain interacting with phosphatidylinositol (3,4,5)-trisphosphate (PI(3,4,5)P₃). The interaction of GRP1-PH with PI(3,4,5)P₃ in a zwitterionic bilayer is compared with the interaction in bilayers containing different levels of anionic 'decoy' lipids. BD simulations reveal both translational and orientational electrostatic steering of the PH domain towards the PI(3,4,5)P₃-containing anionic bilayer surface. There is a payoff between non-PIP anionic lipids attracting the PH domain to the bilayer surface in a favourable orientation and their role as 'decoys', disrupting the interaction of GRP1-PH with the PI(3,4,5)P₃ molecule. Significantly, approximately 20% anionic lipid in the cytoplasmic leaflet of the bilayer is nearly optimal to both enhance orientational steering and to localise GRP1-PH proximal to the surface of the membrane without sacrificing its ability to locate PI(3,4,5)P₃ within the bilayer plane. Subsequent MD simulations reveal binding to PI(3,4,5)P₃, forming protein-phosphate contacts comparable to those in X-ray structures. These studies demonstrate a computational framework which addresses lipid recognition within a cell membrane environment, offering a link between structural and cell biological characterisation.
Conflict of interest statement
The authors have declared that no competing interests exist.
Figures



Similar articles
-
Molecular mechanism of membrane binding of the GRP1 PH domain.J Mol Biol. 2013 Sep 9;425(17):3073-90. doi: 10.1016/j.jmb.2013.05.026. Epub 2013 Jun 6. J Mol Biol. 2013. PMID: 23747485 Free PMC article.
-
Interactions of Pleckstrin Homology Domains with Membranes: Adding Back the Bilayer via High-Throughput Molecular Dynamics.Structure. 2016 Aug 2;24(8):1421-1431. doi: 10.1016/j.str.2016.06.002. Epub 2016 Jul 14. Structure. 2016. PMID: 27427480 Free PMC article.
-
Association of Peripheral Membrane Proteins with Membranes: Free Energy of Binding of GRP1 PH Domain with Phosphatidylinositol Phosphate-Containing Model Bilayers.J Phys Chem Lett. 2016 Apr 7;7(7):1219-24. doi: 10.1021/acs.jpclett.6b00153. Epub 2016 Mar 17. J Phys Chem Lett. 2016. PMID: 26977543 Free PMC article.
-
Counterion-mediated pattern formation in membranes containing anionic lipids.Adv Colloid Interface Sci. 2014 Jun;208:177-88. doi: 10.1016/j.cis.2014.01.016. Epub 2014 Jan 30. Adv Colloid Interface Sci. 2014. PMID: 24556233 Free PMC article. Review.
-
The energetics of protein-lipid interactions as viewed by molecular simulations.Biochem Soc Trans. 2020 Feb 28;48(1):25-37. doi: 10.1042/BST20190149. Biochem Soc Trans. 2020. PMID: 31872229 Free PMC article. Review.
Cited by
-
Membrane surface recognition by the ASAP1 PH domain and consequences for interactions with the small GTPase Arf1.Sci Adv. 2020 Sep 30;6(40):eabd1882. doi: 10.1126/sciadv.abd1882. Print 2020 Sep. Sci Adv. 2020. PMID: 32998886 Free PMC article.
-
Progressive membrane-binding mechanism of SARS-CoV-2 variant spike proteins.iScience. 2022 Aug 19;25(8):104722. doi: 10.1016/j.isci.2022.104722. Epub 2022 Jul 4. iScience. 2022. PMID: 35813872 Free PMC article.
-
Multiscale Simulations of Biological Membranes: The Challenge To Understand Biological Phenomena in a Living Substance.Chem Rev. 2019 May 8;119(9):5607-5774. doi: 10.1021/acs.chemrev.8b00538. Epub 2019 Mar 12. Chem Rev. 2019. PMID: 30859819 Free PMC article.
-
Constant-pH Brownian Dynamics Simulations of a Protein near a Charged Surface.ACS Omega. 2020 Nov 12;5(46):30282-30298. doi: 10.1021/acsomega.0c04817. eCollection 2020 Nov 24. ACS Omega. 2020. PMID: 33251463 Free PMC article.
-
Inositol pyrophosphates: why so many phosphates?Adv Biol Regul. 2015 Jan;57:203-16. doi: 10.1016/j.jbior.2014.09.015. Epub 2014 Oct 5. Adv Biol Regul. 2015. PMID: 25453220 Free PMC article. Review.
References
-
- Lemmon MA. Membrane recognition by phospholipid-binding domains. Nat Rev Mol Cell Biol. 2008;9:99–111. - PubMed
-
- McLaughlin S. The electrostatic properties of membranes. Annu Rev Biophys Biophys Chem. 1989;18:113–136. - PubMed
-
- Mulgrew-Nesbitt A, Diraviyam K, Wang J, Singh S, Murray P, et al. The role of electrostatics in protein-membrane interactions. Biochim Biophys Acta. 2006;1761:812–826. - PubMed
-
- McLaughlin S, Wang J, Gambhir A, Murray D. PIP2 and proteins: interactions, organization, and information flow. Annu Rev Biophys Biomol Struct. 2002;31:151–175. - PubMed
-
- McLaughlin S, Murray D. Plasma membrane phosphoinositide organization by protein electrostatics. Nature. 2005;438:605–611. - PubMed
Publication types
MeSH terms
Substances
Grants and funding
LinkOut - more resources
Full Text Sources
Research Materials
Miscellaneous

