. 2012 Sep 4;109(36):E2382-90.
doi: 10.1073/pnas.1210506109. Epub 2012 Jul 23.

Polar and brown bear genomes reveal ancient admixture and demographic footprints of past climate change

Affiliations

Polar and brown bear genomes reveal ancient admixture and demographic footprints of past climate change

Webb Miller et al. Proc Natl Acad Sci U S A. .

Abstract

Polar bears (PBs) are superbly adapted to the extreme Arctic environment and have become emblematic of the threat to biodiversity from global climate change. Their divergence from the lower-latitude brown bear provides a textbook example of rapid evolution of distinct phenotypes. However, limited mitochondrial and nuclear DNA evidence conflicts in the timing of PB origin as well as placement of the species within versus sister to the brown bear lineage. We gathered extensive genomic sequence data from contemporary polar, brown, and American black bear samples, in addition to a 130,000- to 110,000-y old PB, to examine this problem from a genome-wide perspective. Nuclear DNA markers reflect a species tree consistent with expectation, showing polar and brown bears to be sister species. However, for the enigmatic brown bears native to Alaska's Alexander Archipelago, we estimate that not only their mitochondrial genome, but also 5-10% of their nuclear genome, is most closely related to PBs, indicating ancient admixture between the two species. Explicit admixture analyses are consistent with ancient splits among PBs, brown bears and black bears that were later followed by occasional admixture. We also provide paleodemographic estimates that suggest bear evolution has tracked key climate events, and that PB in particular experienced a prolonged and dramatic decline in its effective population size during the last ca. 500,000 years. We demonstrate that brown bears and PBs have had sufficiently independent evolutionary histories over the last 4-5 million years to leave imprints in the PB nuclear genome that likely are associated with ecological adaptation to the Arctic environment.


Conflict of interest statement

The authors declare no conflict of interest.

Figures

Fig. 1.
Fig. 1.
The number of alleles unique to and shared by three bear species—polar, brown, and American black bear—in all SNP loci (A), and high-quality polymorphic variants resulting in an SAP (B).
Fig. 2.
Fig. 2.
Phylogenetic reconstruction of relationships among bears. (A) Bayesian maximum clade credibility tree reconstructed from mitochondrial genomes (mtDNA), with filled black circles at individual nodes indicating posterior probabilities greater than 0.99 and bootstrap support greater than 99% (diagonal lines indicate truncated branches, and, for the purpose of display, the cave bear genomes have been excluded; SI Appendix, Fig. S5, shows a complete tree). (B) Neighbor joining tree of genetic distances calculated from ∼12 million nuclear-genome SNP markers (nuDNA).
Fig. 3.
Fig. 3.
Phylogenetic discordance and divergence among bears. A schematic species tree (black outline) highlights the discordance between mtDNA and nuclear histories, with the dashed orange line representing the mtDNA gene tree. The figure illustrates introgression and replacement (marked with an X) of PB mitochondrial DNA with an ABC brown bear mitochondrial genome, although the opposite scenario, i.e., capture of PB mitochondrial genome in modern ABC brown bear, cannot be excluded with these data. Two hypotheses of lineage splitting and admixture based on a coalescence hidden Markov model are indicated: (i) an ancient split (4–5 Mya) between the black bear and the brown bear/PB lineage, followed by intermittent gene flow (gray shading) ending by 200 to 100 kya, and (ii) a similarly ancient split between the PBs and brown bears followed by extensive gene flow (gray shading) between ABC brown bears and PBs until very recently. The ancient PB’s lineage is indicated as extinct.
Fig. 4.
Fig. 4.
Potential admixture between polar and ABC brown bears. (A) PCA plot showing the two “projections” that give the estimations of admixed fractions. The reason why the projections do not appear to form right angles is discussed in SI Appendix. (B) An admixture map corresponding to dog chromosome 11, for two ABC brown bears. The scale is in units of 10 million bases. Red areas denote chromosomal regions shared with non-ABC brown bears, and blue indicates where one or both chromosomes are shared with PBs (SI Appendix, Fig. S12, shows a complete map). (C) A magnification of B that includes a 250-kb interval in which both chromosomes in ABC brown bears are very similar to those of our sequenced PBs. The region contains four genes, including the orthologue of ALDH7A1, which may be related to salt tolerance (SI Appendix). The vertical axis is P–Q, where P is the probability of generating the genotype observed in ABC2 given the genotypes observed in PBs and Q is the probability assuming alleles in the non-ABC brown bear (GRZ). Thus, an SNP with a positive value provides evidence that ABC2 is PB-like in this region, whereas a negative value suggests that ABC2 is genetically like the non-ABC brown bear.
Fig. 5.
Fig. 5.
Population-level analyses of 118 brown bears and PBs. (A) Approximate geographical locations of samples. Blue shading represents the current known range of PBs, with the darker shading indicating higher density. (B) PCA plot based on genotypes from ∼100 SNPs. Colors and symbols for samples are as indicated in the legend for A, with triangles representing modern PBs. (C) Structure analysis of brown bears, ABC brown bears, and PBs, with the number of genetic populations set to 2, indicating low levels of admixture present in the genomes of some ABC bears and PBs (black arrowhead indicates position of the ancient PB). (D) Structure analysis with the number of genetic populations set to 3 for 58 PBs from across their range.
Fig. 6.
Fig. 6.
Bear demographic history. (A) PSMC (25) estimates of bear Ne history inferred from four bear genomes, shown in a time span of 5 million years (only one of the ABC brown bears is shown here; SI Appendix, Fig. S14, shows results from all genomes analyzed as well as bootstrap resampling results). The dashed box indicates the time span shown in more detail in B. The large gray-shaded box illustrates the Early Pleistocene, whereas the smaller gray areas refer to key geological events shown in more detail in B and discussed in the text. (B) The larger gray-shaded area to (Right) refers to the Early Pleistocene, and the other gray areas (from right to left) refer to the interglacial Marine Isotope Stages (MIS) 15, 13, and 11, and the Eemian, respectively. The arrows point to major events in bear population history discussed in the text. H, Holocene epoch.
Fig. 7.
Fig. 7.
Potential region of selective sweep in PBs. Top: Position of five short intervals of high FST between PBs and brown bears that map onto dog chromosome 35. Below that is a magnified view of the highest-scoring of the five intervals (and 59th highest scoring genome-wide). This region contains several genes, including a homologue of BTN1A1, which may be related to lipid uptake by cubs (as detailed in the text). For 76 SNPs, we plot the FST, with distances greater than 0.8 shown in blue (i.e., less like brown bears) and less than 0.8 in red (i.e., more like brown bears). Intervals were scored by subtracting 0.8 from FST and summing over all SNPs in the interval. Genome-wide, only 17.1% of SNPs have positive score, and the high density of SNPs with large FST in this region is statistically significant (SI Appendix).
Fig. P1.
Fig. P1.
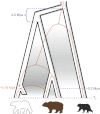
Bear evolutionary history inferred from genome-scale data. (A) Evolutionary relationships of three bear species highlights discordance between maternally inherited mitochondrial (orange dashed line) and biparentally inherited nuclear (black outline) genomes likely as a result of ancient admixture events. The figure illustrates extinction (“X”) and replacement of polar bear mitochondrial DNA with an ABC brown bear mitochondrial genome around 160,000 years ago, although the opposite scenario (i.e., capture of polar bear mitochondrial genome in the modern ABC brown bear) cannot be excluded. Also shown are proposed divergence times among American black, brown, and polar bear lineages (indicated in Mya), as well as the cessation of intermittent periods of gene flow (gray shading) between brown and black bears and between brown and polar bears. The lineage of the ancient polar bear, sequenced in this study, is indicated as extinct. (B) Estimates of changes in effective population size during the past 5 million years, as inferred from four bear genomes, American black bear, non-ABC brown bear, ABC brown bear, and polar bear. The larger gray-shaded area refers to the Early Pleistocene, at the end of which Earth’s glaciations became more severe, and the smaller gray areas (from right to left) refer to interglacial Marine Isotope Stages (MIS) 15, 13, and 11, and the Eemian, respectively. (Photos: S. Farley, J. Schoen, Ø. Wiig.)

Similar articles

  • Insights into bear evolution from a Pleistocene polar bear genome.
    Lan T, Leppälä K, Tomlin C, Talbot SL, Sage GK, Farley SD, Shideler RT, Bachmann L, Wiig Ø, Albert VA, Salojärvi J, Mailund T, Drautz-Moses DI, Schuster SC, Herrera-Estrella L, Lindqvist C. Lan T, et al. Proc Natl Acad Sci U S A. 2022 Jun 14;119(24):e2200016119. doi: 10.1073/pnas.2200016119. Epub 2022 Jun 6. Proc Natl Acad Sci U S A. 2022. PMID: 35666863 Free PMC article.
  • Genomic evidence for island population conversion resolves conflicting theories of polar bear evolution.
    Cahill JA, Green RE, Fulton TL, Stiller M, Jay F, Ovsyanikov N, Salamzade R, St John J, Stirling I, Slatkin M, Shapiro B. Cahill JA, et al. PLoS Genet. 2013;9(3):e1003345. doi: 10.1371/journal.pgen.1003345. Epub 2013 Mar 14. PLoS Genet. 2013. PMID: 23516372 Free PMC article.
  • Complete mitochondrial genome of a Pleistocene jawbone unveils the origin of polar bear.
    Lindqvist C, Schuster SC, Sun Y, Talbot SL, Qi J, Ratan A, Tomsho LP, Kasson L, Zeyl E, Aars J, Miller W, Ingólfsson O, Bachmann L, Wiig O. Lindqvist C, et al. Proc Natl Acad Sci U S A. 2010 Mar 16;107(11):5053-7. doi: 10.1073/pnas.0914266107. Epub 2010 Mar 1. Proc Natl Acad Sci U S A. 2010. PMID: 20194737 Free PMC article.
  • Polar bears: the fate of an icon.
    Fitzgerald KT. Fitzgerald KT. Top Companion Anim Med. 2013 Nov;28(4):135-42. doi: 10.1053/j.tcam.2013.09.007. Top Companion Anim Med. 2013. PMID: 24331553 Review.
  • Ancient genomes.
    Hoelzel AR. Hoelzel AR. Genome Biol. 2005;6(12):239. doi: 10.1186/gb-2005-6-12-239. Epub 2005 Dec 1. Genome Biol. 2005. PMID: 16356273 Free PMC article. Review.

Cited by

References

    1. Green RE, et al. A draft sequence of the Neandertal genome. Science. 2010;328:710–722. - PMC - PubMed
    1. Reich D, et al. Genetic history of an archaic hominin group from Denisova Cave in Siberia. Nature. 2010;468:1053–1060. - PMC - PubMed
    1. vonHoldt BM, et al. A genome-wide perspective on the evolutionary history of enigmatic wolf-like canids. Genome Res. 2011;21:1294–1305. - PMC - PubMed
    1. Lindqvist C, et al. Complete mitochondrial genome of a Pleistocene jawbone unveils the origin of polar bear. Proc Natl Acad Sci USA. 2010;107:5053–5057. - PMC - PubMed
    1. Stirling I. Polar Bears: A Natural History of a Threatened Species. Brighton, MA: Fitzhenry and Whiteside; 2011.

Publication types

Substances

Associated data

LinkOut - more resources