Prolactin-induced protein mediates cell invasion and regulates integrin signaling in estrogen receptor-negative breast cancer
- PMID: 22817771
- PMCID: PMC3680918
- DOI: 10.1186/bcr3232
Prolactin-induced protein mediates cell invasion and regulates integrin signaling in estrogen receptor-negative breast cancer
Abstract
Introduction: Molecular apocrine is a subtype of estrogen receptor (ER)-negative breast cancer that is characterized by a steroid-response gene signature. We have recently identified a positive feedback loop between androgen receptor (AR) and extracellular signal-regulated kinase (ERK) signaling in this subtype. In this study, we investigated the transcriptional regulation of molecular apocrine genes by the AR-ERK feedback loop.
Methods: The transcriptional effects of AR and ERK inhibition on molecular apocrine genes were assessed in cell lines. The most regulated gene in this process, prolactin-induced protein (PIP), was further studied using immunohistochemistry of breast tumors and xenograft models. The transcriptional regulation of PIP was assessed by luciferase reporter assay and chromatin immunoprecipitation. The functional significance of PIP in cell invasion and viability was assessed using siRNA knockdown experiments and the mechanism of PIP effect on integrin-β1 signaling was studied using immunoblotting and immunoprecipitation.
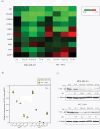
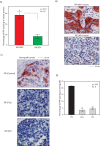
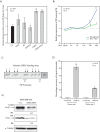
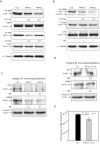
Results: We found that PIP is the most regulated molecular apocrine gene by the AR-ERK feedback loop and is overexpressed in ER-/AR+ breast tumors. In addition, PIP expression is regulated by AR-ERK signaling in xenograft models. These observations are explained by the fact that PIP is a target gene of the ERK-CREB1 pathway and is also induced by AR activation. Furthermore, we demonstrated that PIP has a significant functional role in maintaining cell invasion and viability of molecular apocrine cells because of a positive regulatory effect on the Integrin-ERK and Integrin-Akt signaling pathways. In fact, PIP-knockdown markedly decreases the phosphorylation of ERK, Akt, and CREB1. Importantly, PIP knockdown leads to a marked reduction of integrin-β1 binding to ILK1 and ErbB2 that can be reversed by the addition of fibronectin fragments.
Conclusions: We have identified a novel feedback loop between PIP and CREB1 mediated through the Integrin signaling pathway. In this process, PIP cleaves fibronectin to release fragments that activate integrin signaling, which in turn increases PIP expression through the ERK-CREB1 pathway. In addition, we demonstrated that PIP expression has a profound effect on cell invasion and the viability of molecular apocrine cells. Therefore, PIP signaling may be a potential therapeutic target in molecular apocrine breast cancer.
Figures


Similar articles
-
Prolactin-induced protein is required for cell cycle progression in breast cancer.Neoplasia. 2014 Apr;16(4):329-42.e1-14. doi: 10.1016/j.neo.2014.04.001. Neoplasia. 2014. PMID: 24862759 Free PMC article.
-
A feedback loop between androgen receptor and ERK signaling in estrogen receptor-negative breast cancer.Neoplasia. 2011 Feb;13(2):154-66. doi: 10.1593/neo.101324. Neoplasia. 2011. PMID: 21403841 Free PMC article.
-
Synergy between inhibitors of androgen receptor and MEK has therapeutic implications in estrogen receptor-negative breast cancer.Breast Cancer Res. 2011 Apr 1;13(2):R36. doi: 10.1186/bcr2858. Breast Cancer Res. 2011. PMID: 21457548 Free PMC article.
-
Prolactin-induced protein in breast cancer.Adv Exp Med Biol. 2015;846:189-200. doi: 10.1007/978-3-319-12114-7_8. Adv Exp Med Biol. 2015. PMID: 25472539 Review.
-
An Update on the Molecular and Clinical Characteristics of Apocrine Carcinoma of the Breast.Clin Breast Cancer. 2022 Jun;22(4):e576-e585. doi: 10.1016/j.clbc.2021.12.009. Epub 2021 Dec 27. Clin Breast Cancer. 2022. PMID: 35027319 Review.
Cited by
-
Malignant Apocrine Lesions of the Breast: Multimodality Imaging Findings and Biologic Features.J Breast Cancer. 2022 Dec;25(6):513-521. doi: 10.4048/jbc.2022.25.e46. Epub 2022 Nov 14. J Breast Cancer. 2022. PMID: 36479602 Free PMC article.
-
Prolactin-induced protein is required for cell cycle progression in breast cancer.Neoplasia. 2014 Apr;16(4):329-42.e1-14. doi: 10.1016/j.neo.2014.04.001. Neoplasia. 2014. PMID: 24862759 Free PMC article.
-
Prolactin-Induced Protein is a novel biomarker for Keratoconus.Exp Eye Res. 2019 Feb;179:55-63. doi: 10.1016/j.exer.2018.10.015. Epub 2018 Oct 26. Exp Eye Res. 2019. PMID: 30393162 Free PMC article.
-
Nontoxic Fluorescent Nanoprobes for Multiplexed Detection and 3D Imaging of Tumor Markers in Breast Cancer.Pharmaceutics. 2023 Mar 15;15(3):946. doi: 10.3390/pharmaceutics15030946. Pharmaceutics. 2023. PMID: 36986807 Free PMC article. Review.
-
Prolactin-induced protein (PIP) increases the sensitivity of breast cancer cells to drug-induced apoptosis.Sci Rep. 2023 Apr 21;13(1):6574. doi: 10.1038/s41598-023-33707-w. Sci Rep. 2023. PMID: 37085653 Free PMC article.
References
-
- Guedj M, Marisa L, de Reynies A, Orsetti B, Schiappa R, Bibeau F, MacGrogan G, Lerebours F, Finetti P, Longy M, Bertheau P, Bertrand F, Bonnet F, Martin AL, Feugeas JP, Bieche I, Lehmann-Che J, Lidereau R, Birnbaum D, Bertucci F, de The H, Theillet C. A refined molecular taxonomy of breast cancer. Oncogene. 2012;14:1196–1206. doi: 10.1038/onc.2011.301. - DOI - PMC - PubMed
-
- Farmer P, Bonnefoi H, Becette V, Tubiana-Hulin M, Fumoleau P, Larsimont D, Macgrogan G, Bergh J, Cameron D, Goldstein D, Duss S, Nicoulaz AL, Brisken C, Fiche M, Delorenzi M, Iggo R. Identification of molecular apocrine breast tumours by microarray analysis. Oncogene. 2005;14:4660–4671. doi: 10.1038/sj.onc.1208561. - DOI - PubMed
-
- Teschendorff AE, Naderi A, Barbosa-Morais NL, Caldas C. PACK: Profile Analysis using Clustering and Kurtosis to find molecular classifiers in cancer. Bioinformatics. 2006;14:2269–2275. - PubMed
Publication types
MeSH terms
Substances
LinkOut - more resources
Full Text Sources
Other Literature Sources
Medical
Research Materials
Miscellaneous

