

Role of MXD3 in proliferation of DAOY human medulloblastoma cells
- PMID: 22808009
- PMCID: PMC3393725
- DOI: 10.1371/journal.pone.0038508
Role of MXD3 in proliferation of DAOY human medulloblastoma cells
Abstract
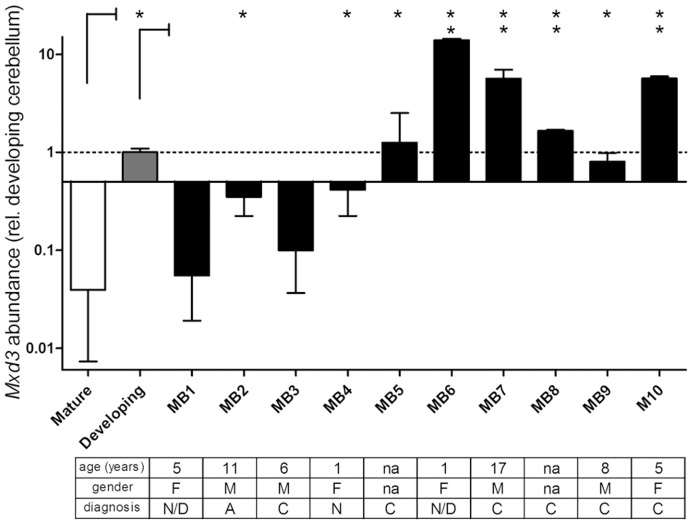
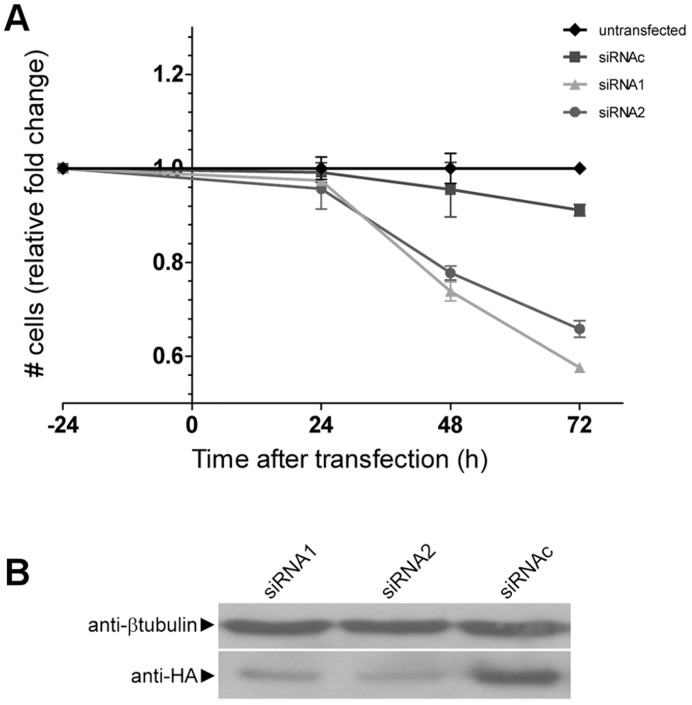
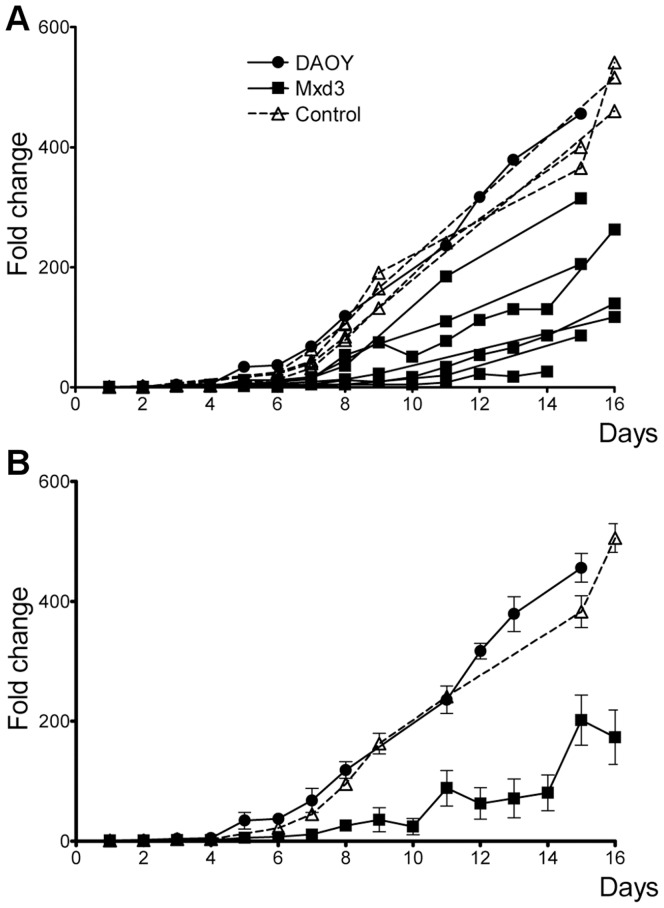
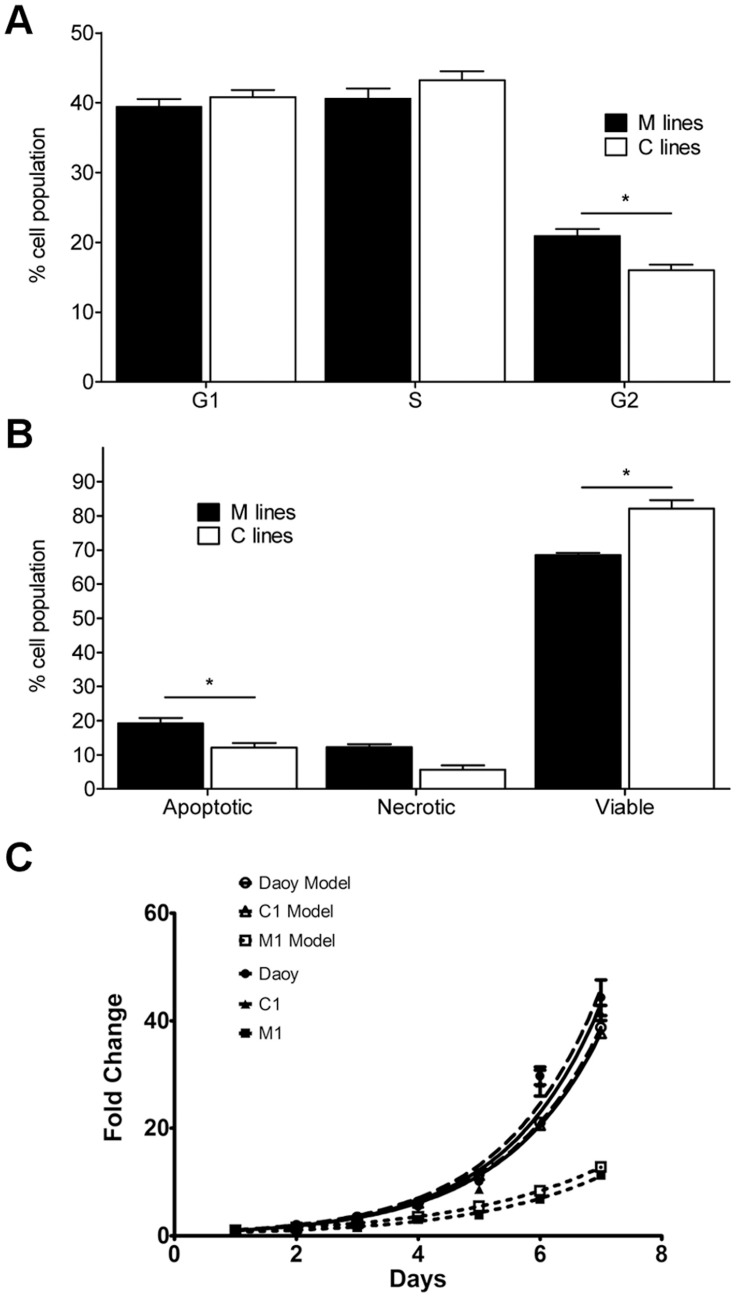
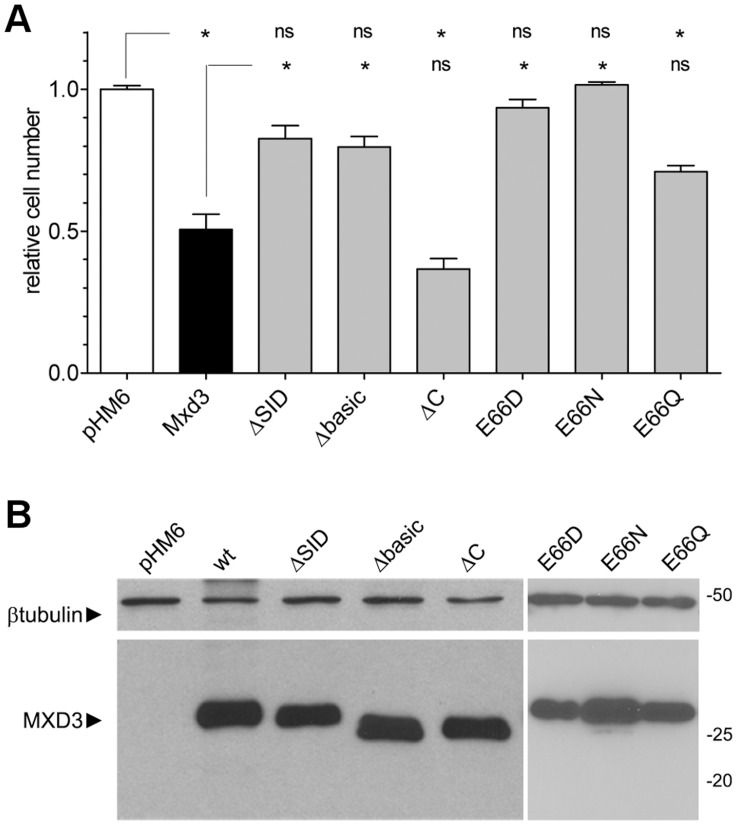
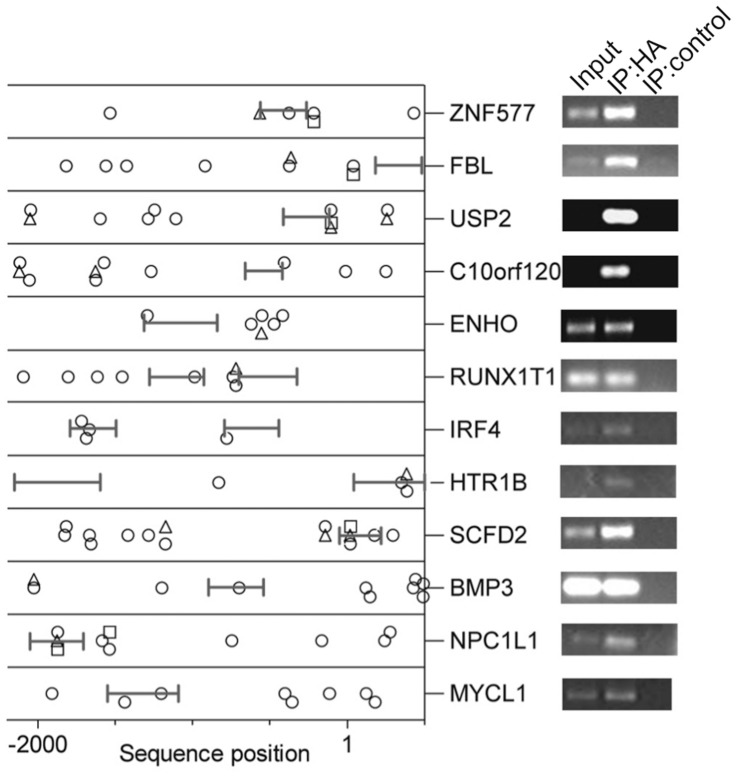
A subset of medulloblastomas, the most common brain tumor in children, is hypothesized to originate from granule neuron precursors (GNPs) in which the sonic hedgehog (SHH) pathway is over-activated. MXD3, a basic helix-look-helix zipper transcription factor of the MAD family, has been reported to be upregulated during postnatal cerebellar development and to promote GNP proliferation and MYCN expression. Mxd3 is upregulated in mouse models of medulloblastoma as well as in human medulloblastomas. Therefore, we hypothesize that MXD3 plays a role in the cellular events that lead to medulloblastoma biogenesis. In agreement with its proliferative role in GNPs, MXD3 knock-down in DAOY cells resulted in decreased proliferation. Sustained overexpression of MXD3 resulted in decreased cell numbers due to increased apoptosis and cell cycle arrest. Structure-function analysis revealed that the Sin3 interacting domain, the basic domain, and binding to E-boxes are essential for this activity. Microarray-based expression analysis indicated up-regulation of 84 genes and down-regulation of 47 genes. Potential direct MXD3 target genes were identified by ChIP-chip. Our results suggest that MXD3 is necessary for DAOY medulloblastoma cell proliferation. However, increased level and/or duration of MXD3 expression ultimately reduces cell numbers via increased cell death and cell cycle arrest.
Conflict of interest statement
Figures
Similar articles
-
MXD3 regulation of DAOY cell proliferation dictated by time course of activation.BMC Cell Biol. 2014 Jul 23;15:30. doi: 10.1186/1471-2121-15-30. BMC Cell Biol. 2014. PMID: 25053245 Free PMC article.
-
The miR-17/92 polycistron is up-regulated in sonic hedgehog-driven medulloblastomas and induced by N-myc in sonic hedgehog-treated cerebellar neural precursors.Cancer Res. 2009 Apr 15;69(8):3249-55. doi: 10.1158/0008-5472.CAN-08-4710. Epub 2009 Apr 7. Cancer Res. 2009. PMID: 19351822 Free PMC article.
-
Loss of MXD3 induces apoptosis of Reh human precursor B acute lymphoblastic leukemia cells.Blood Cells Mol Dis. 2015 Apr;54(4):329-35. doi: 10.1016/j.bcmd.2014.12.002. Epub 2014 Dec 20. Blood Cells Mol Dis. 2015. PMID: 25554682 Free PMC article.
-
From cerebellar proliferation to tumorigenesis: new insights into the role of Mad3.Cell Cycle. 2008 Feb 15;7(4):423-7. doi: 10.4161/cc.7.4.5413. Epub 2007 Dec 6. Cell Cycle. 2008. PMID: 18235219 Review.
-
The role of chromatin remodeling in medulloblastoma.Brain Pathol. 2013 Mar;23(2):193-9. doi: 10.1111/bpa.12019. Brain Pathol. 2013. PMID: 23432644 Free PMC article. Review.
Cited by
-
Amylin deposition in the brain: A second amyloid in Alzheimer disease?Ann Neurol. 2013 Oct;74(4):517-26. doi: 10.1002/ana.23956. Epub 2013 Jul 12. Ann Neurol. 2013. PMID: 23794448 Free PMC article.
-
Focus formation: a cell-based assay to determine the oncogenic potential of a gene.J Vis Exp. 2014 Dec 31;(94):51742. doi: 10.3791/51742. J Vis Exp. 2014. PMID: 25590282 Free PMC article.
-
Overexpression of MAX dimerization protein 3 (MXD3) predicts poor prognosis in clear cell renal cell carcinoma.Transl Androl Urol. 2021 Feb;10(2):785-796. doi: 10.21037/tau-20-1187. Transl Androl Urol. 2021. PMID: 33718080 Free PMC article.
-
cMyc/miR-125b-5p signalling determines sensitivity to bortezomib in preclinical model of cutaneous T-cell lymphomas.PLoS One. 2013;8(3):e59390. doi: 10.1371/journal.pone.0059390. Epub 2013 Mar 19. PLoS One. 2013. PMID: 23527180 Free PMC article.
-
MXD3 as an Immunological and Prognostic Factor From Pancancer Analysis.Front Mol Biosci. 2021 Nov 11;8:702206. doi: 10.3389/fmolb.2021.702206. eCollection 2021. Front Mol Biosci. 2021. PMID: 34859046 Free PMC article.
References
-
- Polkinghorn WR, Tarbell NJ. Medulloblastoma: tumorigenesis, current clinical paradigm, and efforts to improve risk stratification. Nat Clin Pract Oncol. 2007;4:295–304. - PubMed
-
- Wechsler-Reya R, Scott MP. The developmental biology of brain tumors. Annu Rev Neurosci. 2001;24:385–428. - PubMed
-
- Wechsler-Reya RJ, Scott MP. Control of neuronal precursor proliferation in the cerebellum by Sonic Hedgehog. Neuron. 1999;22:103–114. - PubMed
-
- Eisenman RNE. The Myc/Max/Mad Transcription Factor Network. Berlin: Springer. 2006.
Publication types
MeSH terms
Substances
Grants and funding
LinkOut - more resources
Full Text Sources
