Campylobacter epidemiology: a descriptive study reviewing 1 million cases in England and Wales between 1989 and 2011
- PMID: 22798256
- PMCID: PMC3400078
- DOI: 10.1136/bmjopen-2012-001179
Campylobacter epidemiology: a descriptive study reviewing 1 million cases in England and Wales between 1989 and 2011
Abstract
Objectives: To review Campylobacter cases in England and Wales over 2 decades and examine the main factors/mechanisms driving the changing epidemiology.
Design: A descriptive study of Campylobacter patients between 1989 and 2011. Cases over 3 years were linked anonymously to postcode, population density, deprivation indices and census data. Cases over 5 years were anonymously linked to local weather exposure estimates.
Setting: Patients were from general practice, hospital and environmental health investigations through primary diagnostic laboratories across England and Wales.
Participants: There were 1 109 406 cases.
Outcome measures: Description of changes in Campylobacter epidemiology over 23 years and how the main drivers may influence these.
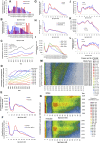
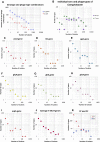
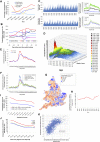
Results: There was an increase in Campylobacter cases over the past 23 years, with the largest increase in people over 50 years. Changes in the underlying population have contributed to this, including the impacts of population increases after World War I, World War II and the 'baby boom' of the 1960s. A recent increase in risk or ascertainment within this population has caused an increase in cases in all age groups from 2004 to 2011. The seasonal increase in cases between weeks 18 (Early May) and 22 (Early June) was consistent across ages, years and regions and was most marked in children and in more rural regions. Campylobacter prevalence by week in each region correlated with temperature 2 weeks before. There were higher prevalences in areas with a low population density, low deprivation and lower percentage of people of ethnic origin. Data from sero-phage and multilocus sequence typing show a few common types and many uncommon types.
Conclusions: The drivers/mechanisms influencing seasonality, age distribution, population density, socioeconomic and long-term differences are diverse and their relative contributions remain to be established. Surveillance and typing provide insights into Campylobacter epidemiology and sources of infection, providing a sound basis for targeted interventions.
Conflict of interest statement
Figures


Similar articles
-
Temperature-driven Campylobacter seasonality in England and Wales.Appl Environ Microbiol. 2005 Jan;71(1):85-92. doi: 10.1128/AEM.71.1.85-92.2005. Appl Environ Microbiol. 2005. PMID: 15640174 Free PMC article.
-
Seasonality and the effects of weather on Campylobacter infections.BMC Infect Dis. 2019 Mar 13;19(1):255. doi: 10.1186/s12879-019-3840-7. BMC Infect Dis. 2019. PMID: 30866826 Free PMC article.
-
Demographic determinants for Campylobacter infection in England and Wales: implications for future epidemiological studies.Epidemiol Infect. 2008 Dec;136(12):1717-25. doi: 10.1017/S0950268808000319. Epidemiol Infect. 2008. PMID: 19000328 Free PMC article.
-
Outbreaks of campylobacter infection: rare events for a common pathogen.Commun Dis Rep CDR Rev. 1997 Mar 7;7(3):R33-7. Commun Dis Rep CDR Rev. 1997. PMID: 9080726 Review.
-
Candida and candidaemia. Susceptibility and epidemiology.Dan Med J. 2013 Nov;60(11):B4698. Dan Med J. 2013. PMID: 24192246 Review.
Cited by
-
Elucidating the aetiology of human Campylobacter coli infections.PLoS One. 2013 May 29;8(5):e64504. doi: 10.1371/journal.pone.0064504. Print 2013. PLoS One. 2013. PMID: 23734204 Free PMC article.
-
Campylobacter spp. Prevalence in Santiago, Chile: A Study Based on Molecular Detection in Clinical Stool Samples from 2014 to 2019.Pathogens. 2023 Mar 22;12(3):504. doi: 10.3390/pathogens12030504. Pathogens. 2023. PMID: 36986425 Free PMC article.
-
Method comparison for enhanced recovery, isolation and qualitative detection of C. jejuni and C. coli from wastewater effluent samples.Int J Environ Res Public Health. 2015 Mar 2;12(3):2749-64. doi: 10.3390/ijerph120302749. Int J Environ Res Public Health. 2015. PMID: 25739008 Free PMC article.
-
The association between alcohol consumption and osteoarthritis: a meta-analysis and meta-regression of observational studies.Rheumatol Int. 2021 Sep;41(9):1577-1591. doi: 10.1007/s00296-021-04844-0. Epub 2021 Mar 20. Rheumatol Int. 2021. PMID: 33745000 Free PMC article.
-
Influence of socio-economic status on Shiga toxin-producing Escherichia coli (STEC) infection incidence, risk factors and clinical features.Epidemiol Infect. 2019 Jan;147:e215. doi: 10.1017/S0950268819000864. Epidemiol Infect. 2019. PMID: 31364538 Free PMC article.
References
-
- Mullner P, Shadbolt T, Collins-Emerson JM, et al. Molecular and spatial epidemiology of human campylobacteriosis: source association and genotype-related risk factors. Epidemiol Infect 2010;138:1372–83 - PubMed
-
- Mullner P, Spencer SE, Wilson DJ, et al. Assigning the source of human campylobacteriosis in New Zealand: a comparative genetic and epidemiological approach. Infect Genet Evol 2009;9:1311–19 - PubMed
LinkOut - more resources
Full Text Sources
Miscellaneous
