The presence of the Y-chromosome, not the absence of the second X-chromosome, alters the mRNA levels stored in the fully grown XY mouse oocyte
- PMID: 22792347
- PMCID: PMC3391287
- DOI: 10.1371/journal.pone.0040481
The presence of the Y-chromosome, not the absence of the second X-chromosome, alters the mRNA levels stored in the fully grown XY mouse oocyte
Erratum in
-
Correction: The Presence of the Y-Chromosome, Not the Absence of the Second X-Chromosome, Alters the mRNA Levels Stored in the Fully Grown XY Mouse Oocyte.PLoS One. 2015 Nov 23;10(11):e0143788. doi: 10.1371/journal.pone.0143788. eCollection 2015. PLoS One. 2015. PMID: 26599439 Free PMC article.
Abstract
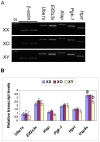
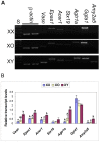
The oocytes of B6.Y(TIR) sex-reversed female mouse mature in culture but fail to develop after fertilization because of their cytoplasmic defects. To identify the defective components, we compared the gene expression profiles between the fully-grown oocytes of B6.Y(TIR) (XY) females and those of their XX littermates by cDNA microarray. 173 genes were found to be higher and 485 genes were lower in XY oocytes than in XX oocytes by at least 2-fold. We compared the transcript levels of selected genes by RT-PCR in XY and XX oocytes, as well as in XO oocytes missing paternal X-chromosomes. All genes tested showed comparable transcript levels between XX and XO oocytes, indicating that mRNA accumulation is well adjusted in XO oocytes. By contrast, in addition to Y-encoded genes, many genes showed significantly different transcript levels in XY oocytes. We speculate that the presence of the Y-chromosome, rather than the absence of the second X-chromosome, caused dramatic changes in the gene expression profile in the XY fully-grown oocyte.
Conflict of interest statement
Figures


Similar articles
-
The behavior of the X- and Y-chromosomes in the oocyte during meiotic prophase in the B6.Y(TIR)sex-reversed mouse ovary.Reproduction. 2008 Feb;135(2):241-52. doi: 10.1530/REP-07-0383. Reproduction. 2008. PMID: 18239052
-
Live-borns from XX but not XY oocytes in the chimeric mouse ovary composed of B6.Y(TIR) and XX cells.Biol Reprod. 1998 Feb;58(2):574-82. doi: 10.1095/biolreprod58.2.574. Biol Reprod. 1998. PMID: 9475416
-
Effects of the Sex Chromosome Complement, XX, XO, or XY, on the Transcriptome and Development of Mouse Oocytes During Follicular Growth.Front Genet. 2021 Dec 20;12:792604. doi: 10.3389/fgene.2021.792604. eCollection 2021. Front Genet. 2021. PMID: 34987552 Free PMC article.
-
Role of the X and Y Chromosomes in the Female Germ Cell Line Development in the Mouse (Mus musculus).Sex Dev. 2022;16(5-6):355-364. doi: 10.1159/000521151. Epub 2022 Mar 2. Sex Dev. 2022. PMID: 35235936 Review.
-
Aberrant chromosomal sex-determining mechanisms in mammals, with special reference to species with XY females.Philos Trans R Soc Lond B Biol Sci. 1988 Dec 1;322(1208):83-95. doi: 10.1098/rstb.1988.0116. Philos Trans R Soc Lond B Biol Sci. 1988. PMID: 2907806 Review.
Cited by
-
Sex chromosome quadrivalents in oocytes of the African pygmy mouse Mus minutoides that harbors non-conventional sex chromosomes.Chromosoma. 2019 Sep;128(3):397-411. doi: 10.1007/s00412-019-00699-4. Epub 2019 Mar 27. Chromosoma. 2019. PMID: 30919035
-
Masculinised Behaviour of XY Females in a Mammal with Naturally Occuring Sex Reversal.Sci Rep. 2016 Mar 11;6:22881. doi: 10.1038/srep22881. Sci Rep. 2016. PMID: 26964761 Free PMC article.
-
The expression of Y-linked Zfy2 in XY mouse oocytes leads to frequent meiosis 2 defects, a high incidence of subsequent early cleavage stage arrest and infertility.Development. 2014 Feb;141(4):855-66. doi: 10.1242/dev.091165. Development. 2014. PMID: 24496622 Free PMC article.
-
Oocyte heterogeneity with respect to the meiotic silencing of unsynapsed X chromosomes in the XY female mouse.Chromosoma. 2013 Oct;122(5):337-49. doi: 10.1007/s00412-013-0415-z. Epub 2013 Jun 13. Chromosoma. 2013. PMID: 23760560
-
Correction: The Presence of the Y-Chromosome, Not the Absence of the Second X-Chromosome, Alters the mRNA Levels Stored in the Fully Grown XY Mouse Oocyte.PLoS One. 2015 Nov 23;10(11):e0143788. doi: 10.1371/journal.pone.0143788. eCollection 2015. PLoS One. 2015. PMID: 26599439 Free PMC article.
References
-
- Zheng P, Dean J. Oocyte-specific genes affect folliculogenesis, fertilization, and early development. Semin Reprod Med. 2007;25:243–251. - PubMed
-
- Kaplan G, Abreu SL, Bachvarova R. rRNA accumulation and protein synthetic patterns in growing mouse oocytes. J Exp Zool. 1982;220:361–370. - PubMed
-
- Paynton BV, Rempel R, Bachvarova R. Changes in state of adenylation and time course of degradation of maternal mRNAs during oocyte maturation and early embryonic development in the mouse. Dev Biol. 1988;129:304–314. - PubMed
-
- Roller RJ, Kinloch RA, Hiraoka BY, Li SS, Wassarman PM. Gene expression during mammalian oogenesis and early embryogenesis: quantification of three messenger RNAs abundant in fully grown mouse oocytes. Development. 1989;106:251–261. - PubMed
Publication types
MeSH terms
Substances
Grants and funding
LinkOut - more resources
Full Text Sources
Other Literature Sources
Molecular Biology Databases

