. 2012 Aug;51(1-2):22-31.
doi: 10.1016/j.mcn.2012.07.001. Epub 2012 Jul 10.

Purkinje cell dysfunction and delayed death in plasma membrane calcium ATPase 2-heterozygous mice

Affiliations

Purkinje cell dysfunction and delayed death in plasma membrane calcium ATPase 2-heterozygous mice

Amanda K Fakira et al. Mol Cell Neurosci. 2012 Aug.

Abstract

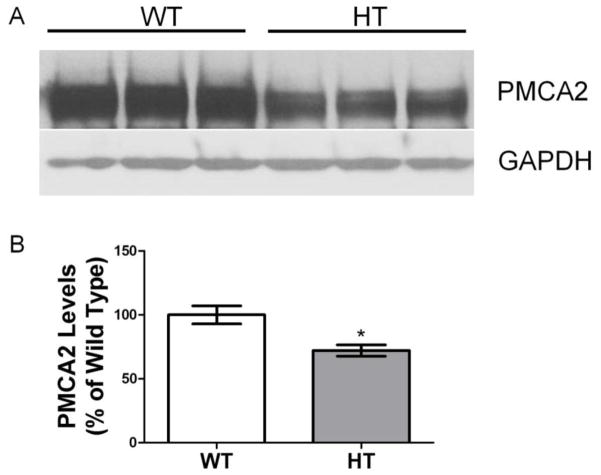
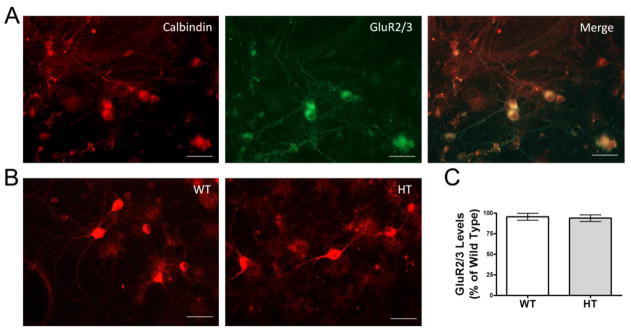
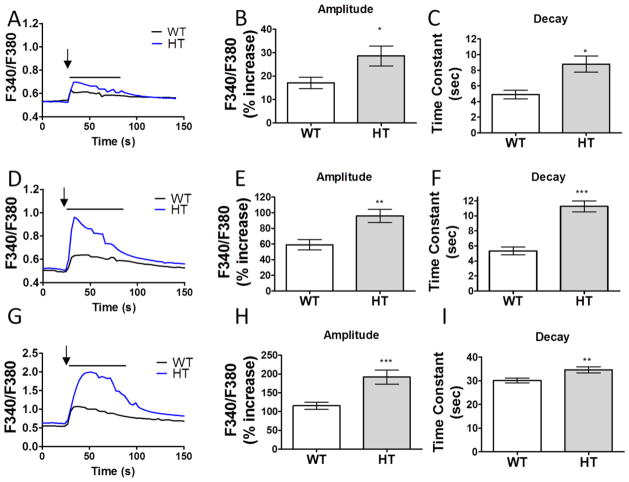
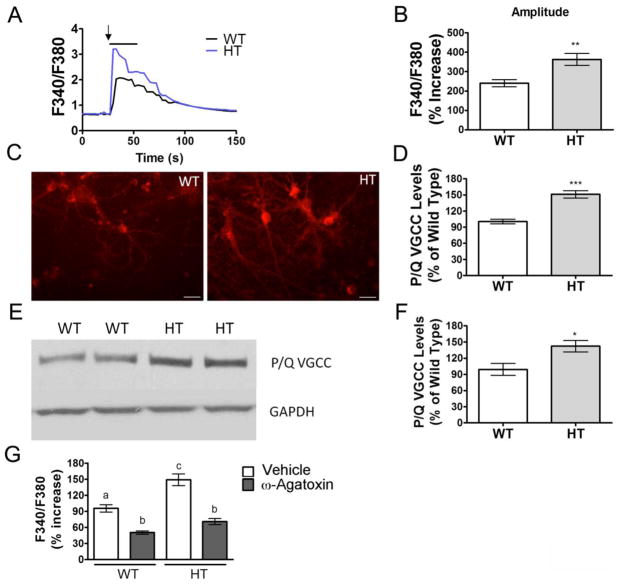
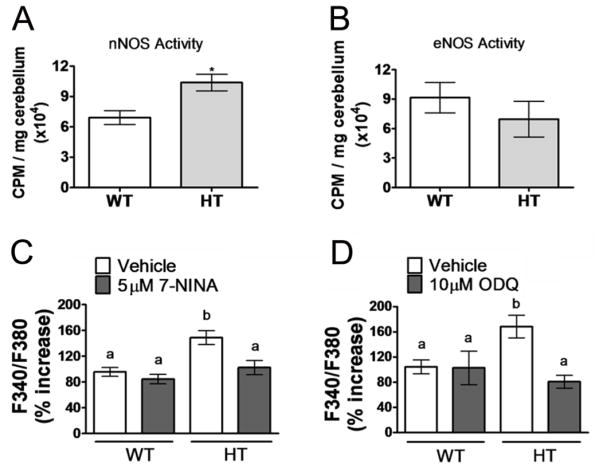
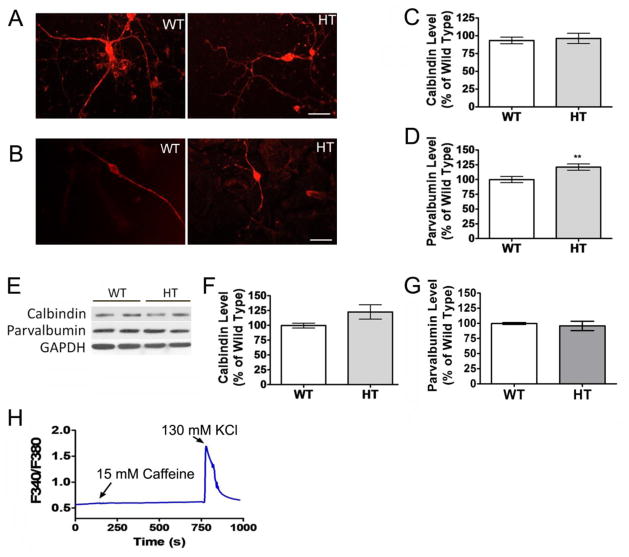
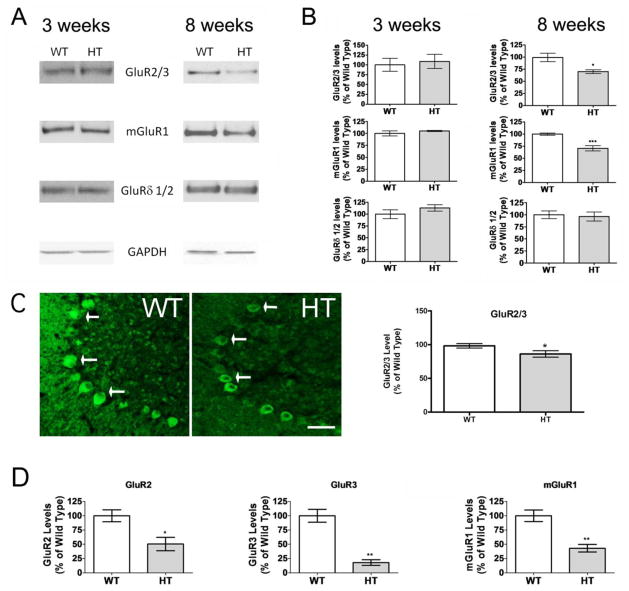
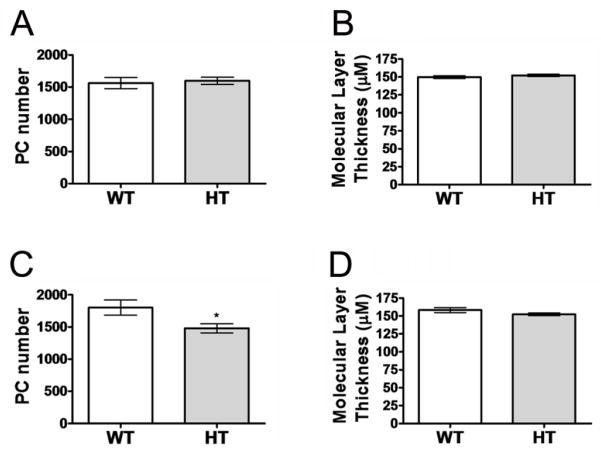
Purkinje cell (PC) dysfunction or death has been implicated in a number of disorders including ataxia, autism and multiple sclerosis. Plasma membrane calcium ATPase 2 (PMCA2), an important calcium (Ca(2+)) extrusion pump that interacts with synaptic signaling complexes, is most abundantly expressed in PCs compared to other neurons. Using the PMCA2 heterozygous mouse as a model, we investigated whether a reduction in PMCA2 levels affects PC function. We focused on Ca(2+) signaling and the expression of glutamate receptors which play a key role in PC function including synaptic plasticity. We found that the amplitude of depolarization and 2-amino-3-(5-methyl-3-oxo-1,2-oxazol-4-yl)propanoic acid receptor (AMPAR)-mediated Ca(2+) transients are significantly higher in cultured PMCA2(+/-) PCs than in PMCA2(+/+) PCs. This is due to increased Ca(2+) influx, since P/Q type voltage-gated Ca(2+) channel (VGCC) expression was more pronounced in PCs and cerebella of PMCA2(+/-) mice and VGCC blockade prevented the elevation in amplitude. Neuronal nitric oxide synthase (nNOS) activity was higher in PMCA2(+/-) cerebella and inhibition of nNOS or the soluble guanylate cyclase (sGC)-cyclic guanosine monophosphate (cGMP) pathway, which mediates nitric oxide (NO) signaling, reduced the amplitude of Ca(2+) transients in PMCA2(+/-) PCs, in vitro. In addition, there was an age-dependent decrease in metabotropic glutamate receptor 1 (mGluR1) and AMPA receptor subunit GluR2/3 transcript and protein levels at 8 weeks of age. These changes were followed by PC loss in the 20-week-old PMCA2(+/-) mice. Our studies highlight the importance of PMCA2 in Ca(2+) signaling, glutamate receptor expression and survival of Purkinje cells.


Conflict of interest statement

The authors declare no conflict of interest.

Figures

Figure 1
Figure 1. PMCA2 levels in PMCA2+/+ and PMCA2+/− cerebellum
(A) A representative western blot showing a band at the appropriate molecular weight corresponding to PMCA2 (110 kDa) in protein extracts obtained from 3-week-old PMCA2+/+ (WT) and PMCA2+/− (HT) mouse cerebellum (upper panel). The same blot was stripped and probed with an antibody against GAPDH, a housekeeping protein used to account for experimental variations (lower panel) (B) Quantification of western blots after normalization to GAPDH. The graphs show the mean ± S.E.M. of two independent experiments. Significantly different from WT *p<0.05 by t-test. N=6 mice/group,
Figure 2
Figure 2. Characterization of enriched PC cultures
(A) PCs maintained 14 DIV and immunolabeled for calbindin (left panel) and GluR2/3 (middle panel). The merged image demonstrates co-localization (right panel). (B) Representative PC cultures derived from PMCA2+/− (HT) and PMCA2+/+ (WT) cerebella immunoreactive for GluR2/3. (C) Quantification of the GluR2/3 levels in PC cultures. There was no significant difference in the levels of GluR2/3 (PMCA2+/+, n=68 cells/4 mice; PMCA2+/−, n= 86 cells/4 mice). Bar represents 30 μm. The experiment was repeated twice and yielded similar results.
Figure 3
Figure 3. The amplitude of AMPAR-mediated Ca2+ transients is increased in PMCA2+/− PCs, in vitro
(A) A representative trace showing the mean intracellular Ca2+ increase after stimulation of cells with 3 μM AMPA. Arrow indicates the time of AMPA application and bar indicates the duration of the treatment prior to the washout. (B and C). Quantification of Ca2+ transient amplitudes (PMCA2+/+ n=55 cells/3 mice vs PMCA2+/− n=96 cells/3 mice) and decay time constants (PMCA2+/+ n=17 cells/3 mice vs PMCA2+/− n=34 cells/3 mice), respectively, after application of 3 μM AMPA. (D) A representative trace showing the mean intracellular Ca2+ increase after stimulation with 10 μM AMPA. (E and F). Quantification of Ca2+ transient amplitudes (PMCA2+/+ n=56 cells/3 mice vs PMCA2+/− n=98 cells/3 mice) and decay time constants (PMCA2+/+ n=54 cells/3 mice vs PMCA2+/− n=93 cells/3 mice), respectively, after application of 10 μM AMPA. (G) A representative trace showing the mean intracellular Ca2+ increase after stimulation with 100 μM AMPA. (H and I) Quantification Ca2+ transient amplitudes (PMCA2+/+ n=144 cell/12 mice vs PMCA2+/− n=170 cells/13 mice) and decay time constants (PMCA2+/+ n=118 cells/12 mice vs PMCA2+/− n=102 cells/13 mice), respectively, after application of 100 μM AMPA. Each treatment was repeated 2–3 times. Statistically significant by unpaired t-test, * p<0.05, ** p<0.001, *** p<0.0001.
Figure 4
Figure 4
The expression of P/Q type VGCCs is increased in the cerebellum and enriched PC cultures of PMCA2+/− (HT) mice. (A) The trace showing the mean intracellular Ca2+ response after stimulation of cultures with 130 mM KCl. Arrow indicates application of KCl and the bar represents the washout period. (B) Quantification of Ca2+ transient amplitudes in KCl stimulated PCs (PMCA2+/+ n=65 cells/7 mice vs PMCA2+/−n=130 cells/8 mice; Significantly different from the wild type (WT) by unpaired t-test; **p< 0.001). (C) Representative PCs maintained 14 DIV and immunolabeled for P/Q-type VGCCs. Bar represents 30 μm. (D) Quantification of the P/Q-type VGCCs immunoreactivity in PMCA2+/+ (WT) and PMCA2+/− (HT) PCs. There was an increase in P/Q-type VGCC levels in PCs of PMCA2+/− mice (PMCA2+/+ n=36 cells/4 mice vs PMCA2+/− n=59 cells/4 mice. Significantly different from WT by unpaired t-test, *** p<0.0001). (E) Representative western blot probed for P/Q-type VGCCs in 3-week-old PMCA2+/− and PMCA2+/+ mouse cerebellum (F) Quantification of western blots shown in E. There was a 43.0±15.3% increase in VGCC levels in PMCA2+/− mice when compared with PMCA2+/+ controls (Significantly different from WT by unpaired t-test, * p<0.05, n=6 cerebella/group). (G) Inhibition of AMPAR-induced (100 μM AMPA) [Ca2+]i increases by 200 nM ω-agatoxin TK. (PMCA2+/+: n=128 cells/6 mice and PMCA2+/−: n=106 cells/5 mice. a=significantly different from c, b = significantly different from a and c by one-way ANOVA p<0.0001, Bonferroni’s post-hoc test). The experiments were repeated twice and yielded similar results.
Figure 5
Figure 5. nNOS activity in the cerebellum of PMCA2+/+ (WT) and PMCA2+/− (HT) mice
(A and B) Quantification of specific nNOS and eNOS activity (Significantly different from WT by unpaired t-test * p<0.05, n=4–5 mice/group). (C) Restoration of AMPAR-mediated (100 μM AMPA) Ca2+ transient amplitude in PMCA2+/− PCs after treatment with 5 μM 7-NINA for 7 days (PMCA2+/+: vehicle n=128 cells/6 mice vs 5 μM 7-NINA n=129 cells/6 mice; PMCA2+/−: vehicle n=106 cells/5 mice vs 5 μM 7-NINA n=86 cells/5 mice. b= significantly different from a by one-way ANOVA p<0.0001, Bonferroni’s post-hoc test). (D). Restoration of AMPAR-mediated (100 μM AMPA) Ca2+ transient amplitude in PMCA2+/− PCs after treatment with 10 μM ODQ for 7 days (PMCA2+/+: vehicle n=36 cells/3 mice vs 10 μM ODQ n=16 cells/3 mice; PMCA2+/− vehicle n=55 cells/5 mice vs 10 μM ODQ n=41 cells/5 mice. The results were analyzed by one-way ANOVA, (Bonferroni’s post-hoc test), b= significantly different from a, p<0.0001. The experiment was repeated twice and yielded similar results.
Figure 6
Figure 6. Calcium binding proteins calbindin and parvalbumin and endoplasmic reticulum Ca2+ release do not contribute to the increased amplitude of Ca2+ transients in PMCA2+/− PCs
(A and B) Representative PCs grown in culture for 14 DIV stained for calbindin (A) and parvalbumin (B). Bar represents 30 μm. (C and D) Quantification of calbindin and parvalbumin immunoreactivity. There was no significant difference in calbindin level (PMCA2+/+ n=86 cells/4 mice; PMCA2+/− n=55 cells/3 mice). Parvalbumin level showed a small increase in PMCA2+/− PCs compared to PMCA2+/+ PCs (PMCA2+/− n=73 cells/3 mice vs PMCA2+/+ n=68 cells/3 mice; Significantly different from WT by unpaired t-test, ** p<0.001) (E) A representative western blot showing calbindin and parvalbumin expression in PMCA2+/− and PMCA2+/+ mouse cerebella at 3 weeks of age. (F–G) Quantification of western blots shown in (E). There were no significant differences in the levels of either protein (n=6/group). (H) Representative trace following stimulation of cultured PCs with 15 mM caffeine. Note that caffeine does not evoke a calcium transient. Each experiment was repeated twice and yielded similar results.
Figure 7
Figure 7. Expression of glutamate receptors in PMCA2+/− cerebellum at 3 and 8 weeks of age
(A) Representative western blots showing a band at the appropriate molecular weight corresponding to GluR2/3 (110 kDa), mGluR1 (133 kDa), GluRδ2 (114 kDa) in 3- and 8-week-old PMCA2+/− (HT) and PMCA2+/+ (WT) mice. (B) Quantification of western blots shown in A. There was no significant difference in glutamate receptor levels at 3 weeks of age. Levels of GluR2/3 and mGluR1 were lower in PMCA2+/− cerebellum by 8 week of age. Significantly different from WT by unpaired t-test, * p<0.05, ** p<0.001, *** p<0.0001, n=4/group. n=6/goup. The experiment was repeated 3 times and yielded similar results. (C) Two photomicrographs showing GluR2/3 immunoreactive PCs in the wild type (WT) and PMCA2+/−_ (HT) mice. Arrows point to labeled PCs. Bar represents 30 μm. (left panel). The graph on the right panel is the quantification of the signal in individual PCs. n=33–35 cells/group * p<0.05 by unpaired t-test. (D) Quantification of GluR2, GluR3 and mGluR1 transcript levels by real time RT-PCR at 8 weeks of age. Significantly different from wild type * p<0.05, ** p<0.001, * n=4/group.
Figure 8
Figure 8. Decreased Purkinje cell number at 20 weeks of age
(A–B) Purkinje cell number and molecular layer thickness are not significantly different at 8 weeks of age in PMCA2+/− (HT) mice when compared with PMCA2+/+ (WT) mice. (C–D) At 20 weeks of age, there is a reduction in PC number in PMCA2+/− mice but no significant change in the thickness of the molecular layer. Significantly different from WT by unpaired t-test, * p<0.05, n=5/group. The experiment was repeated 3 times and yielded similar results.

Similar articles

Cited by

References

    1. Aiba A, Kano M, Chen C, Stanton ME, Fox GD, Herrup K, Zwingman TA, Tonegawa S. Deficient cerebellar long-term depression and impaired motor learning in mGluR1 mutant mice. Cell. 1994;79:377–388. - PubMed
    1. Bauman ML, Kemper TL. Neuroanatomic observations of the brain in autism: a review and future directions. Int J Dev Neurosci. 2005;23:183–187. - PubMed
    1. Brorson JR, Bleakman D, Gibbons SJ, Miller RJ. The properties of intracellular calcium stores in cultured rat cerebellar neurons. J Neurosci. 1991;11:4024–4043. - PMC - PubMed
    1. Burette A, Rockwood JM, Strehler EE, Weinberg RJ. Isoform-specific distribution of the plasma membrane Ca2+ ATPase in the rat brain. J Comp Neurol. 2003;467:464–476. - PubMed
    1. Burette AC, Strehler EE, Weinberg RJ. A plasma membrane Ca2+ ATPase isoform at the postsynaptic density. Neuroscience. 2010;169:987–993. - PMC - PubMed

Publication types

MeSH terms