

Direct quantification of microRNA at low picomolar level in sera of glioma patients using a competitive hybridization followed by amplified voltammetric detection
- PMID: 22788545
- PMCID: PMC3418408
- DOI: 10.1021/ac203368h
Direct quantification of microRNA at low picomolar level in sera of glioma patients using a competitive hybridization followed by amplified voltammetric detection
Abstract
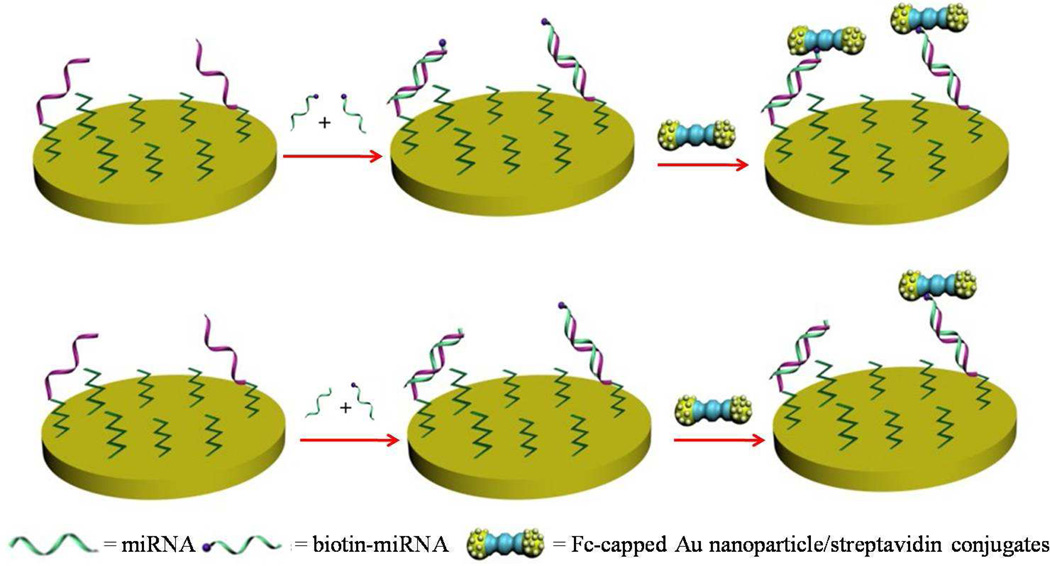
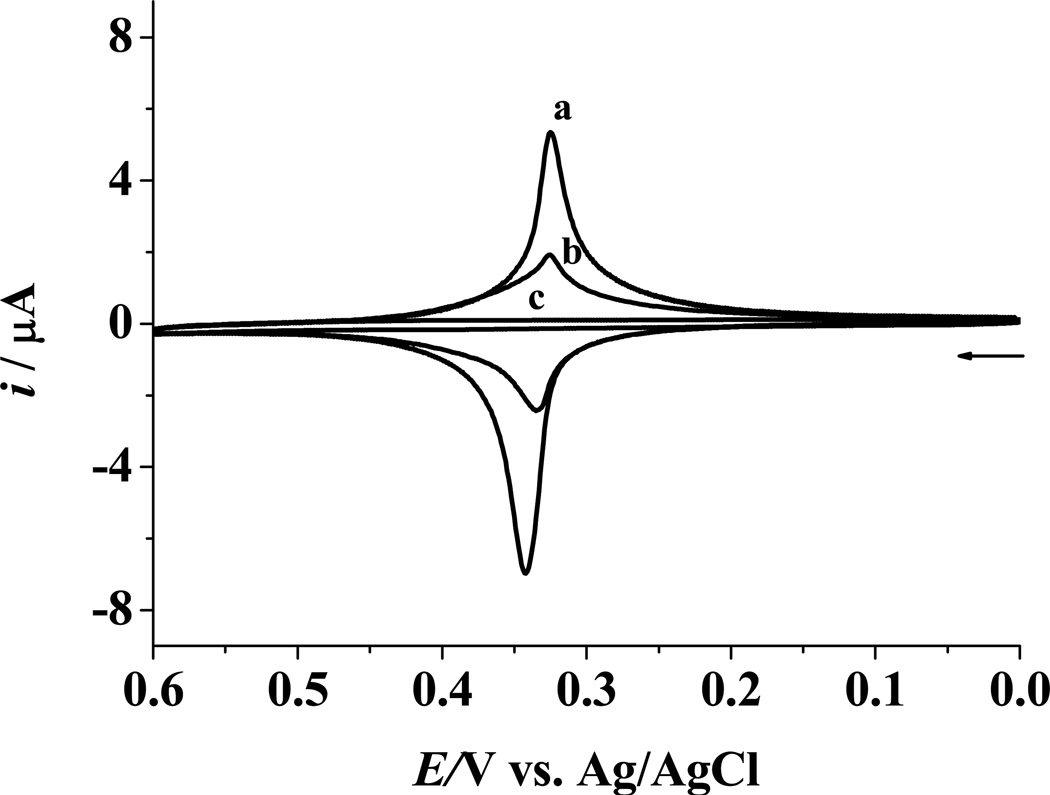
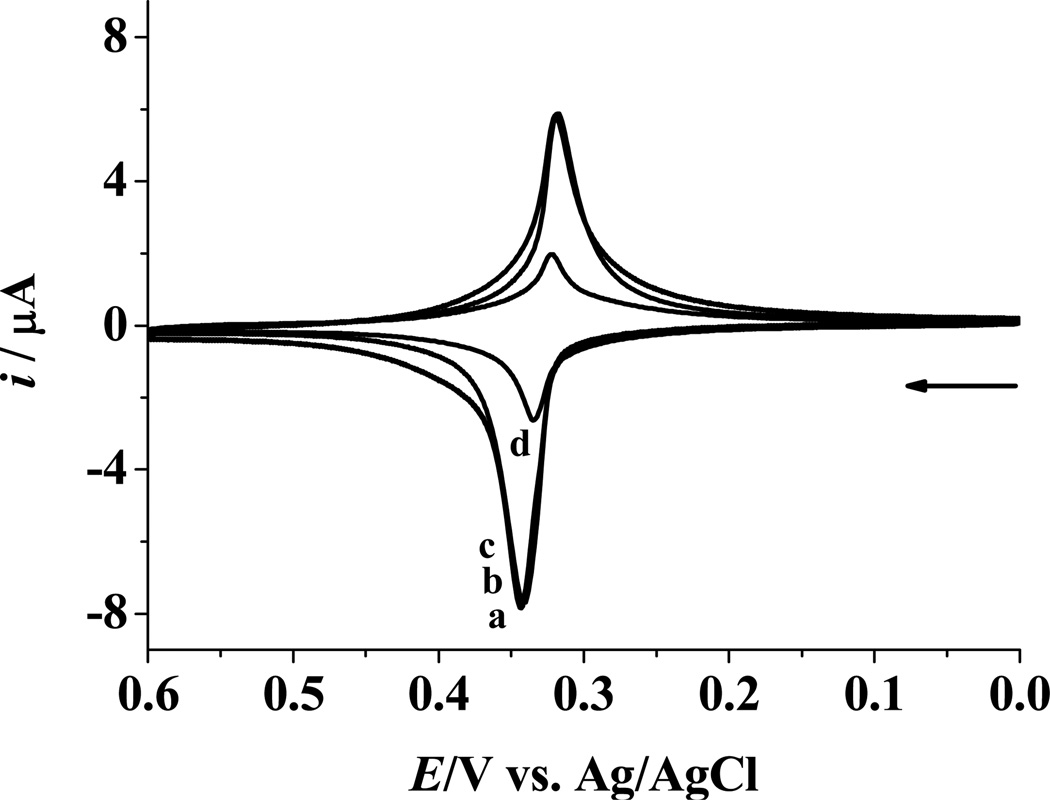
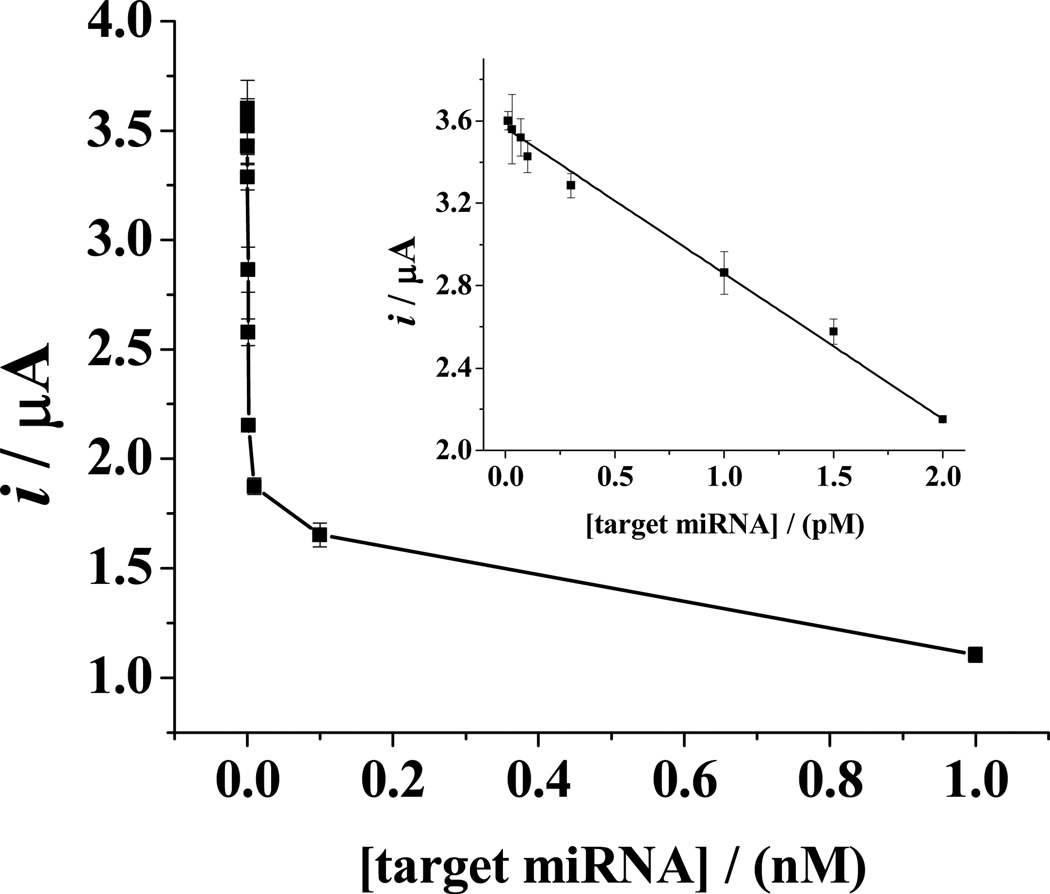
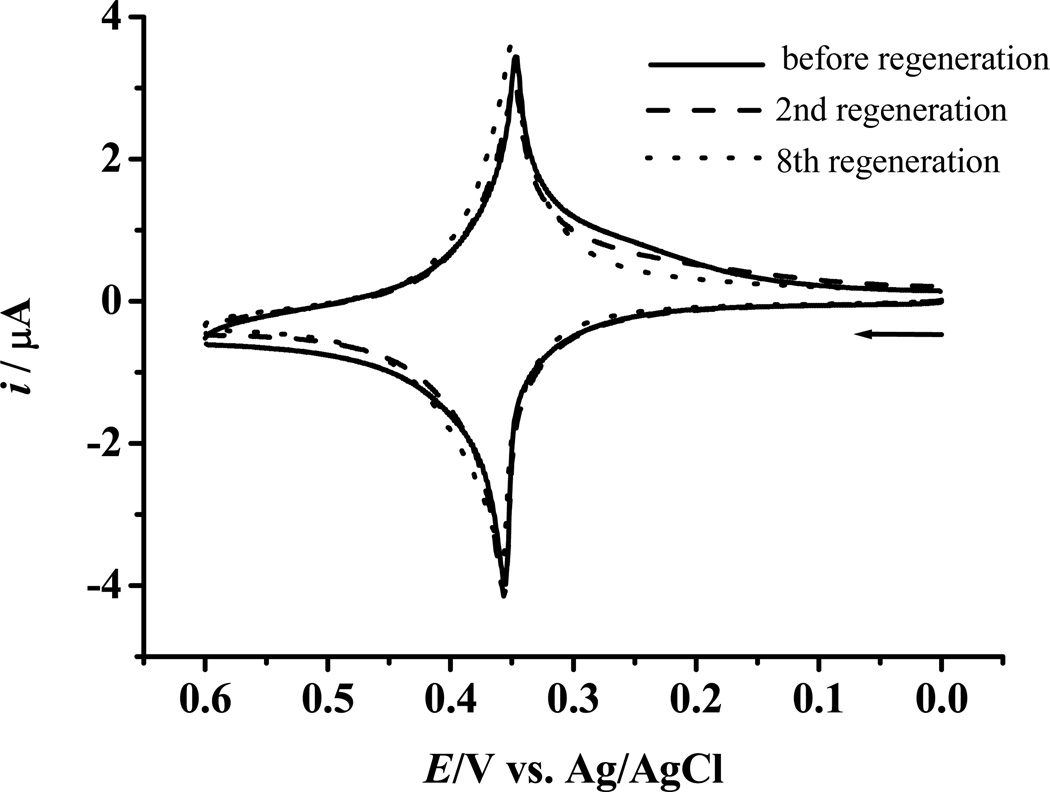
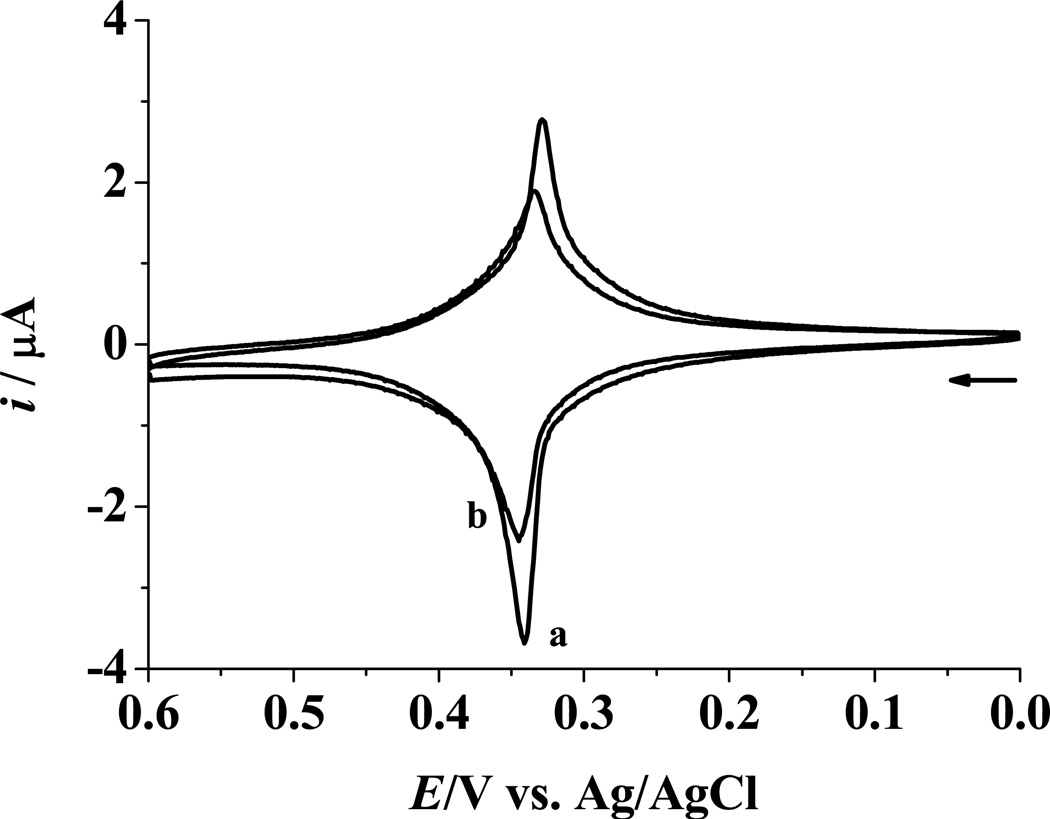
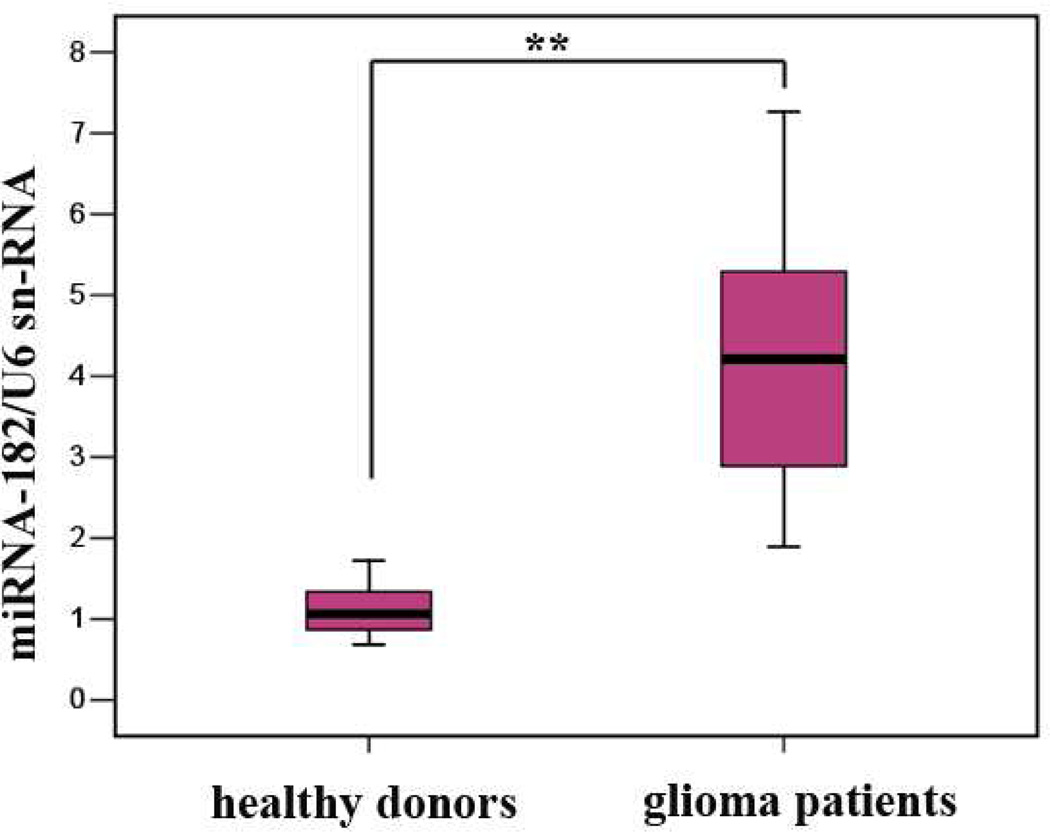
MicroRNAs (miRNAs), acting as oncogenes or tumor suppressors in humans, play a key role in regulating gene expression and are believed to be important for developing novel therapeutic treatments and clinical prognoses. Due to their short lengths (17-25 nucleotides) and extremely low concentrations (typically < picomolar) in biological samples, quantification of miRNAs has been challenging to conventional biochemical methods, such as Northern blotting, microarray, and quantitative polymerase chain reaction (qPCR). In this work, a biotinylated miRNA (biotin-miRNA) whose sequence is the same as that of a miRNA target is introduced into samples of interest and allowed to compete with the miRNA target for the oligonucleotide (ODN) probe preimmobilized onto an electrode. Voltammetric quantification of the miRNA target was accomplished after complexation of the biotin-miRNA with ferrocene (Fc)-capped gold nanoparticle/streptavidin conjugates. The Fc oxidation current was found to be inversely proportional to the concentration of target miRNA between 10 fM and 2.0 pM. The method is highly reproducible (relative standard deviation (RSD) < 5%), regenerable (at least 8 regeneration/assay cycles without discernible signal decrease), and selective (with sequence specificity down to a single nucleotide mismatch). The low detection levels (10 fM or 0.1 attomoles of miRNA in a 10 μL solution) allow the direct quantification of miRNA-182, a marker correlated to the progression of glioma in patients, to be performed in serum samples without sample pretreatment and RNA extraction and enrichment. The concentration of miRNA-182 in glioma patients was found to be 3.1 times as high as that in healthy persons, a conclusion in excellent agreement with a separate qPCR measurement of the expression level. The obviations of the requirement of an internal reference in qPCR, simplicity, and cost-effectiveness are other additional advantages of this method for detection of nucleic acids in clinical samples.
Figures
Similar articles
-
Amplified voltammetric detection of miRNA from serum samples of glioma patients via combination of conducting magnetic microbeads and ferrocene-capped gold nanoparticle/streptavidin conjugates.Biosens Bioelectron. 2016 Dec 15;86:502-507. doi: 10.1016/j.bios.2016.07.010. Epub 2016 Jul 5. Biosens Bioelectron. 2016. PMID: 27442080
-
Multiplexed Electrochemical Detection of MiRNAs from Sera of Glioma Patients at Different Stages via the Novel Conjugates of Conducting Magnetic Microbeads and Diblock Oligonucleotide-Modified Gold Nanoparticles.Anal Chem. 2017 Oct 17;89(20):10834-10840. doi: 10.1021/acs.analchem.7b02342. Epub 2017 Oct 5. Anal Chem. 2017. PMID: 28956430
-
Competitive RNA-RNA hybridization-based integrated nanostructured-disposable electrode for highly sensitive determination of miRNAs in cancer cells.Biosens Bioelectron. 2017 May 15;91:40-45. doi: 10.1016/j.bios.2016.12.033. Epub 2016 Dec 13. Biosens Bioelectron. 2017. PMID: 27987409
-
Femtomolar direct voltammetric determination of circulating miRNAs in sera of cancer patients using an enzymeless biosensor.Anal Chim Acta. 2020 Apr 1;1104:188-198. doi: 10.1016/j.aca.2020.01.016. Epub 2020 Jan 15. Anal Chim Acta. 2020. PMID: 32106951
-
MicroRNA sensors based on gold nanoparticles.Anal Bioanal Chem. 2019 Mar;411(9):1807-1824. doi: 10.1007/s00216-018-1450-7. Epub 2018 Nov 3. Anal Bioanal Chem. 2019. PMID: 30390112 Review.
Cited by
-
Blood-Based Biomarkers for Glioma in the Context of Gliomagenesis: A Systematic Review.Front Oncol. 2021 Jun 4;11:665235. doi: 10.3389/fonc.2021.665235. eCollection 2021. Front Oncol. 2021. PMID: 34150629 Free PMC article.
-
Circulating RNAs as new biomarkers for detecting pancreatic cancer.World J Gastroenterol. 2015 Jul 28;21(28):8527-40. doi: 10.3748/wjg.v21.i28.8527. World J Gastroenterol. 2015. PMID: 26229396 Free PMC article. Review.
-
Multiplexed smFRET Nucleic Acid Sensing Using DNA Nanotweezers.Biosensors (Basel). 2023 Jan 10;13(1):119. doi: 10.3390/bios13010119. Biosensors (Basel). 2023. PMID: 36671954 Free PMC article.
-
Electrochemical Genosensing of Circulating Biomarkers.Sensors (Basel). 2017 Apr 14;17(4):866. doi: 10.3390/s17040866. Sensors (Basel). 2017. PMID: 28420103 Free PMC article. Review.
-
Gold Nanoparticles for In Vitro Diagnostics.Chem Rev. 2015 Oct 14;115(19):10575-636. doi: 10.1021/acs.chemrev.5b00100. Epub 2015 Jun 26. Chem Rev. 2015. PMID: 26114396 Free PMC article. Review.
References
-
- Lee Y, Ahn C, Han JJ, Choi H, Kim J, Yim J, Lee J, Provost P, Radmark O, Kim S, Kim VN. Nature. 2003;425:415–419. - PubMed
-
- Buchan JR, Parker R. Science. 2007;318:1877–1878. - PubMed
-
- Calin GA, Croce CM. Cancer Res. 2006;66:7390–7394. - PubMed
-
- Tricoli JV, Jacobson JW. Cancer Res. 2007;67:4553–4555. - PubMed
-
- Cissell KA, Shrestha S, Deo SK. Anal.Chem. 2007;79:4754–4761.
Publication types
MeSH terms
Substances
Grants and funding
LinkOut - more resources
Full Text Sources
Other Literature Sources
