. 2012 Sep;86(18):10123-37.
doi: 10.1128/JVI.01102-12. Epub 2012 Jul 11.

Cell-free transmission of human adenovirus by passive mass transfer in cell culture simulated in a computer model

Affiliations

Cell-free transmission of human adenovirus by passive mass transfer in cell culture simulated in a computer model

Artur Yakimovich et al. J Virol. 2012 Sep.

Abstract

Viruses spread between cells, tissues, and organisms by cell-free and cell-cell transmissions. Both mechanisms enhance disease development, but it is difficult to distinguish between them. Here, we analyzed the transmission mode of human adenovirus (HAdV) in monolayers of epithelial cells by wet laboratory experimentation and a computer simulation. Using live-cell fluorescence microscopy and replication-competent HAdV2 expressing green fluorescent protein, we found that the spread of infection invariably occurred after cell lysis. It was affected by convection and blocked by neutralizing antibodies but was independent of second-round infections. If cells were overlaid with agarose, convection was blocked and round plaques developed around lytic infected cells. Infected cells that did not lyse did not give rise to plaques, highlighting the importance of cell-free transmission. Key parameters for cell-free virus transmission were the time from infection to lysis, the dose of free viruses determining infection probability, and the diffusion of single HAdV particles in aqueous medium. With these parameters, we developed an in silico model using multiscale hybrid dynamics, cellular automata, and particle strength exchange. This so-called white box model is based on experimentally determined parameters and reproduces viral infection spreading as a function of the local concentration of free viruses. These analyses imply that the extent of lytic infections can be determined by either direct plaque assays or can be predicted by calculations of virus diffusion constants and modeling.


Figures
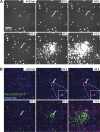
Fig 1
Fig 1
Formation of plaques around infected lysed cells. A transgenic, replication-competent Ad2 with the dE3B region replaced by a CMV-GFP cassette (Ad2-dE3B-GFP) was used to infect monolayers of human lung carcinoma A549 (HLC-A549) cells at 5 · 10−7 mg/ml in 200 μl of culture medium. Infection progression was imaged by multisite time-lapse fluorescence microscopy. (A) GFP signals from infected cells at the indicated time points of infection. Note the occurrence of circular zones of GFP-positive cells around an initially infected cell, a so-called plaque. The arrows in the figure point to the lysing infected cell. (B) Overlay of the GFP signal from infected cells (green), Hoechst 33342 nuclear live dye (Hoechst, blue), and propidium iodide for lysed cells (PI, red). See also Fig. S1 and Movie S1 in the supplemental material.
Fig 2
Fig 2
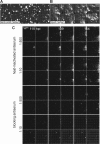
Cell-to-cell infection occurs through the extracellular medium. (A and B) Monolayers of HLC-A549 were inoculated with Ad2-dE3B-GFP expressing eGFP. Two h later, the inoculum was replaced with liquid or gel-forming (semisolid) medium (0.6% ultralow-melting-point agarose mass). This agarose is liquid at 37°C, gels at room temperature, and remains gelled at 37°C. PQs exhibit comet-like shapes in liquid medium and circular shapes in semisolid medium. The micrographs are composites of stitched images taken from multiple sites in 96-well plates at 113.5 hpi. (C) Neutralizing antiserum against HAdV in the culture medium inhibits viral spreading. HLC-A549 cells grown in monolayers in 96-well plates were inoculated with 0.1 ml of medium containing 10−7 mg/ml Ad2-dE3B-GFP for 24 h, supplemented with antiserum containing medium, and then imaged at the indicated time points. Scale bar, 1 mm. See also Fig. S2 and S3 and Movies S2 and S3 in the supplemental material.
Fig 3
Fig 3
Replication-defective HAdV spreads to neighboring cells from an infected donor cell. Ad2-dE1-GFP-infected HER-911 donor cells were seeded at limiting dilutions onto HLC-A549 acceptor cells (1 in 800), which can be infected but do not produce virus particles. The figure shows PQs of Ad2-dE1-GFP, Hoechst, and propidium iodide (PI) composites of a single round of infection. The arrows point to a lysing HER-911 cell. See also Fig. S4 and S5 in the supplemental material.
Fig 4
Fig 4
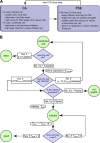
Hybrid model consisting of a CA-PSE. (A) Flow chart of the CA-PSE model; (B) cell state flow chart. Nviruses is the number of diffusing, cell-free viral particles; p has a random value from a uniform distribution, U (0, 1); P(Nviruses | infected) is the probability of infection upon exposure to Nviruses virus particles; dt is the CA time step; P(lysis) is the probability of cell lysis; PT(death) is the time-dependent probability for an uninfected cell to die; and Tlysis is the time until cell lysis.
Fig 5
Fig 5
Parameters of the hybrid CA-PSE model. The parameters listed on the left-hand side affect the CA, while parameters listed on the right-hand side affect the PSE. Parameter values were all derived from experiments in this study, except the number of viral particles produced from a lytic infected cell, which was adapted from reference .
Fig 6
Fig 6
Infection probability, GFP expression kinetics, and overall cell death are virus dose dependent. (A) Multisite time-lapse imaging of HLC-A549 cells infected with different amounts of virus. Automated computational cell segmentation using CellProfiler was used to count all cells and determine the fraction of infected cells. This allowed the measuring of the infection probability as a function of input virus protein concentration. Measurements were performed 72 hpi. (B) To convert the virus protein concentration to the number of viral particles, we used a theoretical number of HAdV particles (TNAP). It was determined from the protein mass of an individual adenovirus particle as described in equation 1. The mean GFP intensity (averaged per well) was measured for each virus concentration. Measurements were made per concentration and per time point with a time resolution of 1 h. This allowed calibrating the GFP intensity increase as a function of time and input Ad2-dE3B-GFP (see Fig. S7 and Movie S4 in the supplemental material). (C) Cells were imaged in the presence of propidium iodide dye (PI) and Hoechst 33342 dye (Hoechst) for 120.5 h. The number of PI-positive cells was plotted for infected (blue) and noninfected (red) cells. Quantification was by CellProfiler based on the Hoechst and PI signals. std, standard deviations.
Fig 7
Fig 7
Simulation output from the hybrid cellular automaton-particle strength exchange. An example of a simulation for AdV2-dE3B-GFP infection is shown. The figure shows the hexagonal CA cell mesh outlined in blue with color-coded cells: red, dead; green, infected. The green color intensities represent relative GFP levels (see Movie S5 in the supplemental material).
Fig 8
Fig 8
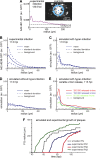
Model validation by radial distribution function of PQ reveals how local HAdV concentrations affect infection. (A) The micrograph and the fluorescence intensity profile depicted in the line graph represent a PQ from a single round of HLC-A549 infection with Ad2-dE1-GFP as analyzed by the radial distribution function (RDF). The RDF provides a distance-dependent sampling of the mean fluorescence intensity averaged around concentric rings around the PQ center. The radius (r) of a PQ is defined as the distance between the PQ center and the radial position where the fluorescence intensity drops to the level of background intensity, which was estimated from cells in uninfected control wells. Panels B and C show average RDFs from 15 different experimental PQs with Ad2-dE3B-GFP (B) or simulated PQs (C) at 113 hpi (solid line), including the ±1 sigma band (dashed lines), and the background fluorescence from the experimental images (dotted line). Fluorescence values were obtained using linear interpolation of the experimental calibration curve. (C) The number of released progeny virus particles was assumed to be 100,000 per lytic infected cell. Hyperinfection of cells close to the lytic infected cell in the PQ center was allowed in the simulation. (D) Average simulated RDF without hyperinfection at 113 hpi. (E) Average simulated mean RDFs for different numbers of released progeny viruses per lysed cell at 113 hpi, 50,000 particles (green), 100,000 particles (blue), and 200,000 particles (red), allowing for hyperinfection. (F) Three representative examples for time-resolved PQ formation from Ad2-dE3B-GFP-infected HLC-A549 cells (colored lines) and a simulated PQ using 100,000 released particles per cell, allowing for hyperinfection (dashed gray line). The observation period was from 43 to 113 hpi.

Similar articles

Cited by

References

    1. Ahmed R, Graham AF. 1977. Persistent infections in L cells with temperature-sensitive mutants of reovirus. J. Virol. 23:250–262 - PMC - PubMed
    1. Amstutz B, et al. 2008. Subversion of CtBP1 controlled macropinocytosis by human adenovirus serotype 3. EMBO J. 27:956–966 - PMC - PubMed
    1. Bais S, Bartee E, Rahman MM, McFadden G, Cogle CR. 2012. Oncolytic virotherapy for hematological malignancies. Adv. Virol. 2012:186512. - PMC - PubMed
    1. Bankhead A, et al. 2011. A simulation framework to investigate in vitro viral infection dynamics. J. Comput. Sci. doi:10.1016/j.jocs.2011.08.007 - DOI - PMC - PubMed
    1. Barton KN, et al. 2006. Second-generation replication-competent oncolytic adenovirus armed with improved suicide genes and ADP gene demonstrates greater efficacy without increased toxicity. Mol. Ther. 13:347–356 - PubMed

Publication types

MeSH terms

LinkOut - more resources