. 2012 Aug 15;189(4):1780-91.
doi: 10.4049/jimmunol.1103768. Epub 2012 Jul 11.

IL-2 receptor signaling is essential for the development of Klrg1+ terminally differentiated T regulatory cells

Affiliations

IL-2 receptor signaling is essential for the development of Klrg1+ terminally differentiated T regulatory cells

Guoyan Cheng et al. J Immunol. .

Abstract

Thymic-derived natural T regulatory cells (Tregs) are characterized by functional and phenotypic heterogeneity. Recently, a small fraction of peripheral Tregs has been shown to express Klrg1, but it remains unclear as to what extent Klrg1 defines a unique Treg subset. In this study, we show that Klrg1(+) Tregs represent a terminally differentiated Treg subset derived from Klrg1(-) Tregs. This subset is a recent Ag-responsive and highly activated short-lived Treg population that expresses enhanced levels of Treg suppressive molecules and that preferentially resides within mucosal tissues. The development of Klrg1(+) Tregs also requires extensive IL-2R signaling. This activity represents a distinct function for IL-2, independent from its contribution to Treg homeostasis and competitive fitness. These and other properties are analogous to terminally differentiated short-lived CD8(+) T effector cells. Our findings suggest that an important pathway driving Ag-activated conventional T lymphocytes also operates for Tregs.


Figures

FIGURE 1
FIGURE 1. Properties of Klrg1+ Tregs from B6 mice
(A) Expression of Klrg1 after gating CD4+ T conventional and CD4+ Foxp3+ Tregs from WT spleen, MLN, PP and the LP of the small intestine. (B, C) The expression of indicated markers on Klrg1+ and Klrg1 splenic (B) and LP (C) Tregs. The expression of Blimp-1 was analyzed in Tregs from WT Blimp/GFP Foxp3/RFP dual reporter mice. Data are representative of 3–8 mice and the % expression or mean fluorescent intensity (MFI) was determined. The MFI values in Klrg1+ or Klrg1 Tregs were normalized to total Tregs.
FIGURE 2
FIGURE 2. Distribution and proliferative activity of Klrg1+ Tregs in allergic hypersensitive mice
Allergy was induced in B6 mice as described in the Methods. Just before the aerosol challenge, the Treg composition was assessed for some of the sensitized mice, as indicated. (A) The expression of Klrg1 by Tregs from the indicated tissues before and after induction of acute asthma. (B) Enumeration of the number of total and Klrg1+ Tregs. (C) Proliferative activity of the indicated Klrg1+ and Klrg1 Tregs based on Ki67 expression. Data are representative of 3–8 mice/group.
FIGURE 3
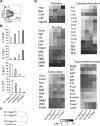
FIGURE 3. Gene expression profile by Treg subsets from B6 mice
Klrg1-depleted Fr1, Fr2, Fr3 and Fr3 Klrg1+ Tregs were purified from the spleen by FACS sorting. Total RNA was isolated and gene expression profiling was performed using Affymetrix Mouse Gene ST 1.0 arrays. Samples (n=2, except Fr3 Klrg1neg, n=4) represent independent biological replicates. (A) Representation of the 3 main Treg fractions (Fr) used for gene array analysis. (B) Protein expression of selected genes by FACS for Treg subsets. Data are mean ± SD for 4 mice per group. (C) Euclidean clustering of sample relatedness for genes that varied by ≥2-fold (over- or under-represented) between the indicated Treg subsets. (D) Genes differentially expressed by (over- or under-represented) only between the indicated Treg subsets. Shown are the expression levels (log2) of selected genes that varied by ≥2-fold between any two subsets except those underlined, which varied by a lower level. Data were analyzed by one-way ANOVA p<0.05, Benjamini and Hochberg correction.
FIGURE 4
FIGURE 4. Treg suppressive activity of Klrg1+ Tregs
(A) Distribution of CTLA4 and CD39 by the indicated splenic Treg subsets. (B) In vitro suppression by the indicated splenic Treg subsets isolated from Foxp3/RFP reporter mice. The % inhibition was determined in comparison to [3H]thymidine incorporation by responder cells lacking Tregs. Results are from 3 experiments.
FIGURE 5
FIGURE 5. IL-2R signaling is required for the development of Klrg1+ Tregs
The expression of Klrg1 (A) and other activation markers (B) by Tregs from the spleen and LP of the indicated B6 mice. Data are from 3–11 mice per group.
FIGURE 6
FIGURE 6. Klrg1 marks a splenic Treg subset
Purified Foxp3/GFP+ WT Tregs (4 × 10⁵) were transferred into the B6 or Y3 adult recipient mice. 4 weeks post-transfer, (A) the percent of total Tregs in CD4+ T cells, (B,C) the number of host (GFP) vs. donor (GFP+) Tregs, and the (C) percentage of donor GFP+ Tregs in total Tregs were determined. (D,E) Total CD4+ Foxp3+ Tregs were gated in spleen (D) and LP (E) and the expression of Klrg1 and CD69 in the GFP+, GFP or total Tregs was determined. Data are representative of 3–4 mice per group.
FIGURE 7
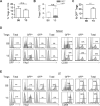
FIGURE 7. The effect of IL2-IC on Treg subsets
(A–D) WT B6 mice received 3 daily injections of IL2-IC complex. 3, 5, or 7 days after the last injection, splenic Tregs were evaluated. Control represents mice that were injected with PBS and were analyzed only 3 days after the last injection. Representative FACS profiles of the indicated markers 3 days after the last injection of IL2-IC (A) and time course of Treg numbers (B) of the indicated populations. (C) Expression of Ki67 and Bcl-2 3 days after the last injection of IL2-IC. (D) Time course for the expression of the indicated markers. Data are from at least 3 mice per group per time point. (E) Splenic Klrg1+ or Klrg1 Tregs (1 × 10⁵) from the Foxp3/RFP reporter mice were injected with splenic conventional CD4+ T cells (1 × 10⁶) from the Foxp3/GFP reporter mice at the ratio of 1:10 into TCRα−/− mice. One day later the recipients received 3 daily injections of IL2-IC. 6 days after the cell transfer, the indicated cell populations from the spleen were analyzed for the expression of RFP and Klrg1. Data are 4–5 mice/group where each point on the graph represents an individual mouse
FIGURE 8
FIGURE 8. Proliferative activity and turnover of Klrg1+ and Klrg1 Tregs
(A) Bcl-2 and Ki67 expression by the indicated CD4+ Foxp3+ Tregs. Data are from 6–8 mice per group. (B,C) Mice received BrdU for 5 days and then were switched to normal water (Day 0). BrdU incorporation was determined for the indicated Treg populations. Linear regression analysis was performed for BrdU loss and compared between Klrg1+ or Klrg1 Treg subsets from the WT B6 and Y3 mice (B) or compared for an indicated individual subset between B6 and Y3 mice (C). The p values of whether the slopes are significantly different are shown within each graph. Data represent 3 mice/group. (D) Purified CD4+ T cells were cultured in medium for the indicated time. Cell viability and recovery were determined for the Klrg1+ and Klrg1 CD4+ Foxp3+ Tregs and compared to the number of Tregs at culture initiation. Data are from 3 experiments.
FIGURE 9
FIGURE 9. Klrg1+ Tregs are terminally differentiated and derived from distinct Klrg1subsets
(A–C) Klrg1+ or Klrg1 Treg subsets (1 × 10⁵) were purified from Thy-1.1+ Foxp3/RFP reporter mice and adoptively transferred with (A-C, F) conventional CD4+ T cells (1 × 10⁶) from Foxp3/GFP reporter mice at 1:10 ratio. The purity of injected cells was verified by FACS analysis (A). 4 weeks post-transfer, the spleen (B) and LP (C) of TCRα−/− recipients were examined for % donor RFP+ nTreg and their expression of Klrg1+. (D) RFP+ Thy-1.1+ Klrg1+ and Klrg1 Treg subsets were transferred alone into Thy-1.2+ TCRα−/− mice and Treg stability was assessed 2 weeks later by enumerating the indicated RFP+ Treg and RFP exTreg Thy-1.1+donor cells from the spleen and MLN. (E) Foxp3/GFP-marked conventional CD4+ T cells (depleted of Tregs) were transferred with Klrg1 Foxp3/RFP Tregs into TCRα−/− recipients and iTreg development was assessed by enumerating CD4+ GFP+ T cells (left) and their development into Klrg1+ iTregs (right) from the spleen and LP 4 weeks post-transfer. All the data were derived from 3–4 mice per group.
FIGURE 10
FIGURE 10. Developmental progression of Klrg1+ Tregs
(A) The indicated Thy-1.1+ RFP+ Tregs (5 × 10⁴) were transferred into Thy-1.2+ Y3 recipients. Two weeks post-transfer the donor cells were examined from the spleen of each recipient. Data are from 3 mice/group. (B) CFSE-labeled CD62Lhi CD69 CD103 Klrg1 Fr1 Tregs were transferred into Y3 mice and the phenotype of the donor cells was determined on the indicated day post transfer (B). The relationship of CD103 and Klrg1 expression as a function of cell division (CFSE-dilution) was determined 6 days post-transfer (C). Data are representative 3 mice/time point.

Similar articles

Cited by

References

    1. Wing K, Sakaguchi S. Regulatory T cells exert checks and balances on self tolerance and autoimmunity. Nat. Immunol. 2010;11:7–13. - PubMed
    1. Zhou L, Chong MM, Littman DR. Plasticity of CD4+ T cell lineage differentiation. Immunity. 2009;30:646–655. - PubMed
    1. Izcue A, Coombes JL, Powrie F. Regulatory lymphocytes and intestinal inflammation. Annu. Rev. Immunol. 2009;27:313–338. - PubMed
    1. Itoh M, Takahashi T, Sakaguchi N, Kunioyasu Y, Shimizu J, Otsuka F, Sakaguchi S. Thymus and autoimmunity: Production of CD25+ CD4+ naturally anergic and suppressive T cells as a key function of the thymus in maintaining immunological self-tolerance. J. Immunol. 1999;162:5317–5326. - PubMed
    1. Thornton AM, Shevach EM. Suppressor effector function of CD4+ CD25+ immunoregulatory T cells is antigen nonspecific. J. Immunol. 2000;164:183–190. - PubMed

Publication types

MeSH terms