The impact of antiretroviral treatment on the age composition of the HIV epidemic in sub-Saharan Africa
- PMID: 22781175
- PMCID: PMC3886374
- DOI: 10.1097/QAD.0b013e3283558526
The impact of antiretroviral treatment on the age composition of the HIV epidemic in sub-Saharan Africa
Abstract
Introduction: Antiretroviral treatment (ART) coverage is rapidly expanding in sub-Saharan Africa (SSA). Based on the effect of ART on survival of HIV-infected people and HIV transmission, the age composition of the HIV epidemic in the region is expected to change in the coming decades. We quantify the change in the age composition of HIV-infected people in all countries in SSA.
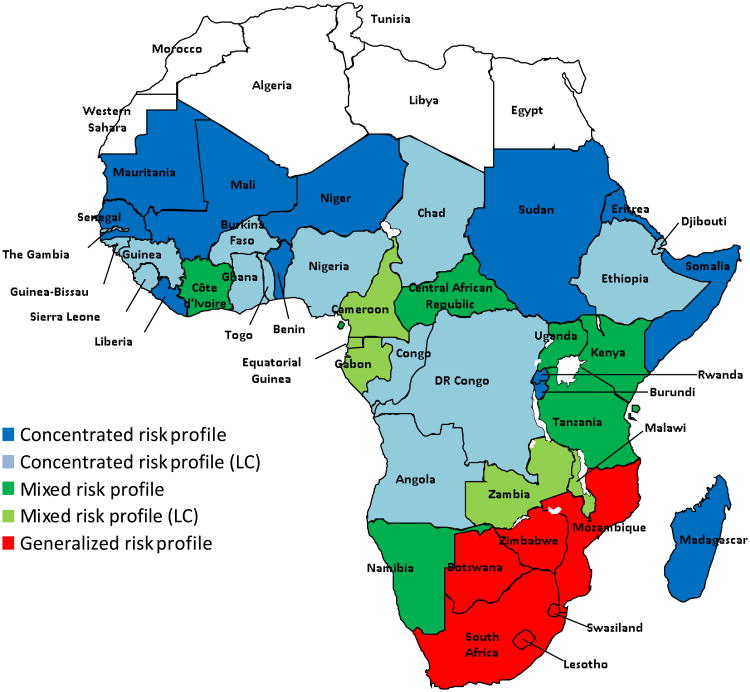
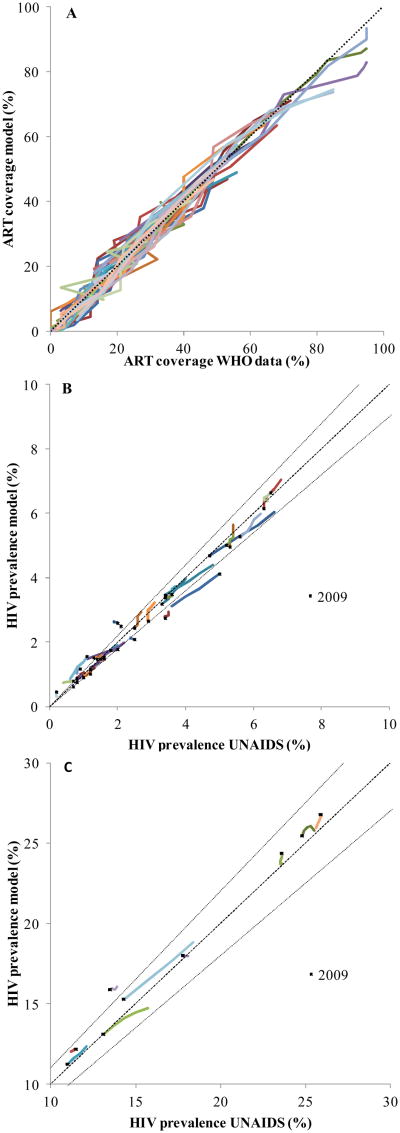
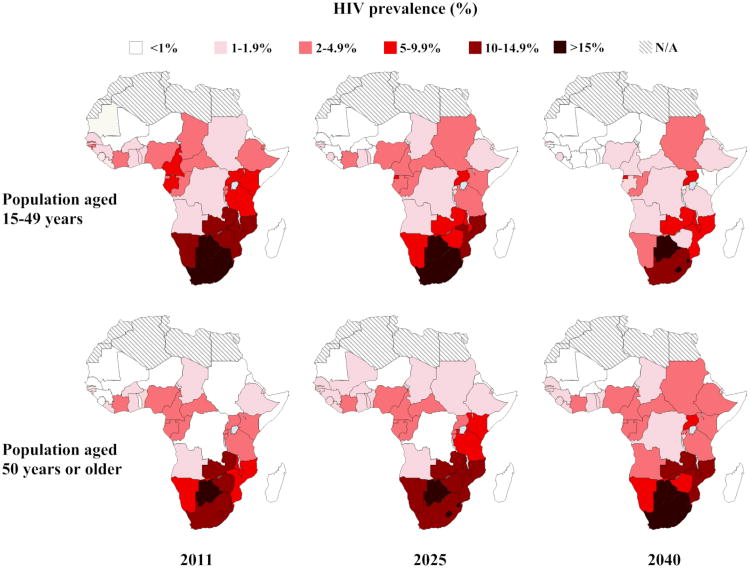
Methods: We used STDSIM, a stochastic microsimulation model, and developed an approach to represent HIV prevalence and treatment coverage in 43 countries in SSA, using publicly available data. We predict future trends in HIV prevalence and total number of HIV-infected people aged 15-49 years and 50 years or older for different ART coverage levels.
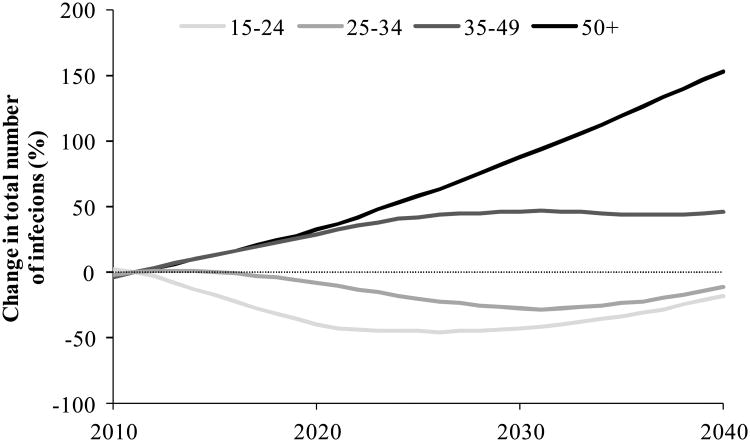
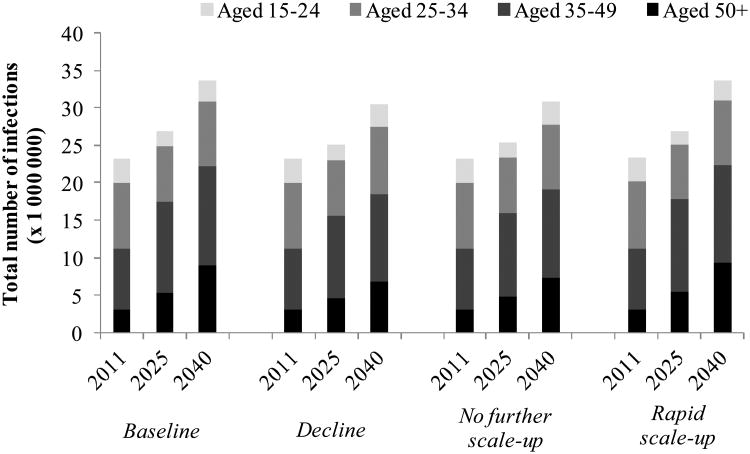
Results: We show that, if treatment coverage continues to increase at present rates, the total number of HIV-infected people aged 50 years or older will nearly triple over the coming years: from 3.1 million in 2011 to 9.1 million in 2040, dramatically changing the age composition of the HIV epidemic in SSA. In 2011, about one in seven HIV-infected people was aged 50 years or older; in 2040, this ratio will be larger than one in four.
Conclusion: The HIV epidemic in SSA is rapidly ageing, implying changing needs and demands in many social sectors, including health, social care, and old-age pension systems. Health policymakers need to anticipate the impact of the changing HIV age composition in their planning for future capacity in these systems.
Figures
Similar articles
-
Human resources for treating HIV/AIDS: needs, capacities, and gaps.AIDS Patient Care STDS. 2007 Nov;21(11):799-812. doi: 10.1089/apc.2007.0193. AIDS Patient Care STDS. 2007. PMID: 17944556
-
Extent to which low-level use of antiretroviral treatment could curb the AIDS epidemic in sub-Saharan Africa.Lancet. 2000 Jun 17;355(9221):2095-100. doi: 10.1016/S0140-6736(00)02375-8. Lancet. 2000. PMID: 10902622
-
Antiretroviral therapy related adverse effects: Can sub-Saharan Africa cope with the new "test and treat" policy of the World Health Organization?Infect Dis Poverty. 2017 Feb 15;6(1):24. doi: 10.1186/s40249-017-0240-3. Infect Dis Poverty. 2017. PMID: 28196511 Free PMC article.
-
Projecting the impact of AIDS on mortality.AIDS. 1998;12 Suppl 1:S29-39. AIDS. 1998. PMID: 9677187 Review.
-
AIDS in sub-Saharan Africa: the epidemiology of heterosexual transmission and the prospects for prevention.Epidemiology. 1993 Jan;4(1):63-72. Epidemiology. 1993. PMID: 8420583 Review.
Cited by
-
Priorities for health and wellbeing for older people with and without HIV in Uganda: a qualitative methods study.J Int AIDS Soc. 2022 Sep;25 Suppl 4(Suppl 4):e26000. doi: 10.1002/jia2.26000. J Int AIDS Soc. 2022. PMID: 36176017 Free PMC article.
-
Is There Any Evidence of Premature, Accentuated and Accelerated Aging Effects on Neurocognition in People Living with HIV? A Systematic Review.AIDS Behav. 2021 Mar;25(3):917-960. doi: 10.1007/s10461-020-03053-3. Epub 2020 Oct 6. AIDS Behav. 2021. PMID: 33025390 Free PMC article.
-
Pneumocystis Jiroveci Pneumonia and Newly Diagnosed Human Immunodeficiency Virus (AIDS) in a 63-Year-Old Woman.Am J Case Rep. 2018 Aug 8;19:927-931. doi: 10.12659/AJCR.909612. Am J Case Rep. 2018. PMID: 30087316 Free PMC article.
-
Patient priority setting in HIV ageing research: exploring the feasibility of community engagement and involvement in Tanzania.Res Involv Engagem. 2023 Feb 17;9(1):3. doi: 10.1186/s40900-022-00409-y. Res Involv Engagem. 2023. PMID: 36805028 Free PMC article.
-
Integrating HIV services and other health services: A systematic review and meta-analysis.PLoS Med. 2021 Nov 9;18(11):e1003836. doi: 10.1371/journal.pmed.1003836. eCollection 2021 Nov. PLoS Med. 2021. PMID: 34752477 Free PMC article.
References
-
- WHO. Towards universal access: scaling up priority HIV/AIDS interventions in the health sector; progress report 2010. Geneva: World Health Organization; 2010.
-
- UN. 2011 High level meeting on AIDS. New York: General Assembly - United Nations; 2011.
-
- Negin J, Mills EJ, Albone R. Continued neglect of ageing of HIV epidemic at UN meeting. Lancet. 2011;378:768. - PubMed
-
- Mills EJ, Bakanda C, Birungi J, Mwesigwa R, Chan K, Ford N, et al. Mortality by baseline CD4 cell count among HIV patients initiating antiretroviral therapy: evidence from a large cohort in Uganda. AIDS. 2011;25:851–855. - PubMed
Publication types
MeSH terms
Substances
Grants and funding
LinkOut - more resources
Full Text Sources
Medical
Research Materials