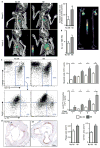
Myocardial infarction accelerates atherosclerosis
- PMID: 22763456
- PMCID: PMC3401326
- DOI: 10.1038/nature11260
Myocardial infarction accelerates atherosclerosis
Abstract
During progression of atherosclerosis, myeloid cells destabilize lipid-rich plaques in the arterial wall and cause their rupture, thus triggering myocardial infarction and stroke. Survivors of acute coronary syndromes have a high risk of recurrent events for unknown reasons. Here we show that the systemic response to ischaemic injury aggravates chronic atherosclerosis. After myocardial infarction or stroke, Apoe-/- mice developed larger atherosclerotic lesions with a more advanced morphology. This disease acceleration persisted over many weeks and was associated with markedly increased monocyte recruitment. Seeking the source of surplus monocytes in plaques, we found that myocardial infarction liberated haematopoietic stem and progenitor cells from bone marrow niches via sympathetic nervous system signalling. The progenitors then seeded the spleen, yielding a sustained boost in monocyte production. These observations provide new mechanistic insight into atherogenesis and provide a novel therapeutic opportunity to mitigate disease progression.
Conflict of interest statement
Marc S. Sabatine, David A. Morrow and Sabina A. Murphy received grant support from AstraZeneca and GSK. The remaining authors declare no competing financial interests.
Figures


Comment in
-
Cardiology: Bad matters made worse.Nature. 2012 Jul 18;487(7407):306-8. doi: 10.1038/487306a. Nature. 2012. PMID: 22810692 Free PMC article.
-
Sympathetic nervous system: a crucial player modulating residual cardiovascular risk.Circ Res. 2013 Jan 4;112(1):13-6. doi: 10.1161/CIRCRESAHA.112.281097. Circ Res. 2013. PMID: 23287453 No abstract available.
Similar articles
-
E-Selectin Inhibition Mitigates Splenic HSC Activation and Myelopoiesis in Hypercholesterolemic Mice With Myocardial Infarction.Arterioscler Thromb Vasc Biol. 2016 Sep;36(9):1802-8. doi: 10.1161/ATVBAHA.116.307519. Epub 2016 Jul 28. Arterioscler Thromb Vasc Biol. 2016. PMID: 27470513 Free PMC article.
-
StemBell therapy stabilizes atherosclerotic plaques after myocardial infarction.Cytotherapy. 2018 Sep;20(9):1143-1154. doi: 10.1016/j.jcyt.2018.05.006. Epub 2018 Aug 12. Cytotherapy. 2018. PMID: 30107976
-
Characterization of a resident population of adventitial macrophage progenitor cells in postnatal vasculature.Circ Res. 2014 Jul 18;115(3):364-75. doi: 10.1161/CIRCRESAHA.115.303299. Epub 2014 Jun 6. Circ Res. 2014. PMID: 24906644
-
Cholesterol efflux: a novel regulator of myelopoiesis and atherogenesis.Arterioscler Thromb Vasc Biol. 2012 Nov;32(11):2547-52. doi: 10.1161/ATVBAHA.112.300134. Arterioscler Thromb Vasc Biol. 2012. PMID: 23077140 Review.
-
Monocyte subsets in atherosclerosis.Hamostaseologie. 2015;35(2):105-12. doi: 10.5482/HAMO-14-08-0030. Epub 2014 Nov 14. Hamostaseologie. 2015. PMID: 25396218 Review.
Cited by
-
Regulation of leucocyte homeostasis in the circulation.Cardiovasc Res. 2015 Aug 1;107(3):340-51. doi: 10.1093/cvr/cvv099. Epub 2015 Mar 5. Cardiovasc Res. 2015. PMID: 25750191 Free PMC article. Review.
-
Apoptosis of hematopoietic progenitor-derived adipose tissue-resident macrophages contributes to insulin resistance after myocardial infarction.Sci Transl Med. 2020 Jul 22;12(553):eaaw0638. doi: 10.1126/scitranslmed.aaw0638. Sci Transl Med. 2020. PMID: 32718989 Free PMC article.
-
Association of Inflammatory Metabolic Activity of Psoas Muscle and Acute Myocardial Infarction: A Preliminary Observational Study with 18F-FDG PET/CT.Diagnostics (Basel). 2021 Mar 13;11(3):511. doi: 10.3390/diagnostics11030511. Diagnostics (Basel). 2021. PMID: 33805700 Free PMC article.
-
ACE Inhibition Modulates Myeloid Hematopoiesis after Acute Myocardial Infarction and Reduces Cardiac and Vascular Inflammation in Ischemic Heart Failure.Antioxidants (Basel). 2021 Mar 5;10(3):396. doi: 10.3390/antiox10030396. Antioxidants (Basel). 2021. PMID: 33807982 Free PMC article.
-
Cardiovascular toxicity of nicotine: Implications for electronic cigarette use.Trends Cardiovasc Med. 2016 Aug;26(6):515-23. doi: 10.1016/j.tcm.2016.03.001. Epub 2016 Mar 10. Trends Cardiovasc Med. 2016. PMID: 27079891 Free PMC article. Review.
References
-
- Goldstein JA, et al. Multiple complex coronary plaques in patients with acute myocardial infarction. N Engl J Med. 2000;343:915–922. - PubMed
-
- Milonas C, et al. Effect of Angiotensin-converting enzyme inhibition on one-year mortality and frequency of repeat acute myocardial infarction in patients with acute myocardial infarction. Am J Cardiol. 2010;105:1229–1234. - PubMed
-
- Libby P, Ridker PM, Hansson GK. Progress and challenges in translating the biology of atherosclerosis. Nature. 2011;473:317–325. - PubMed
-
- Weber C, Noels H. Atherosclerosis: current pathogenesis and therapeutic options. Nat Med. 2011;17:1410–1422. - PubMed
Publication types
MeSH terms
Substances
Grants and funding
- T32 HL094301/HL/NHLBI NIH HHS/United States
- R01 HL095612/HL/NHLBI NIH HHS/United States
- R01 AI084880/AI/NIAID NIH HHS/United States
- T32 CA079443/CA/NCI NIH HHS/United States
- P50-CA086355/CA/NCI NIH HHS/United States
- R01-HL096576/HL/NHLBI NIH HHS/United States
- R01-EB006432/EB/NIBIB NIH HHS/United States
- HHMI/Howard Hughes Medical Institute/United States
- T32-CA79443/CA/NCI NIH HHS/United States
- R01 EB006432/EB/NIBIB NIH HHS/United States
- R01 HL096576/HL/NHLBI NIH HHS/United States
- R01 HL095629/HL/NHLBI NIH HHS/United States
- R01-HL095629/HL/NHLBI NIH HHS/United States
LinkOut - more resources
Full Text Sources
Other Literature Sources
Medical
Molecular Biology Databases
Miscellaneous

