. 2012:2:488.
doi: 10.1038/srep00488. Epub 2012 Jul 3.

The distinct roles of the nucleus and nucleus-cytoskeleton connections in three-dimensional cell migration

Affiliations

The distinct roles of the nucleus and nucleus-cytoskeleton connections in three-dimensional cell migration

Shyam B Khatau et al. Sci Rep. 2012.

Abstract

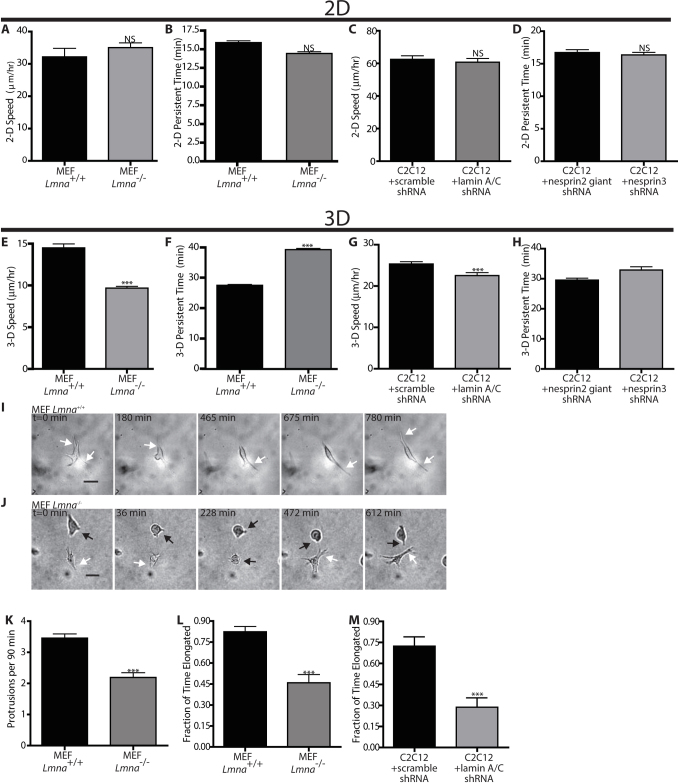
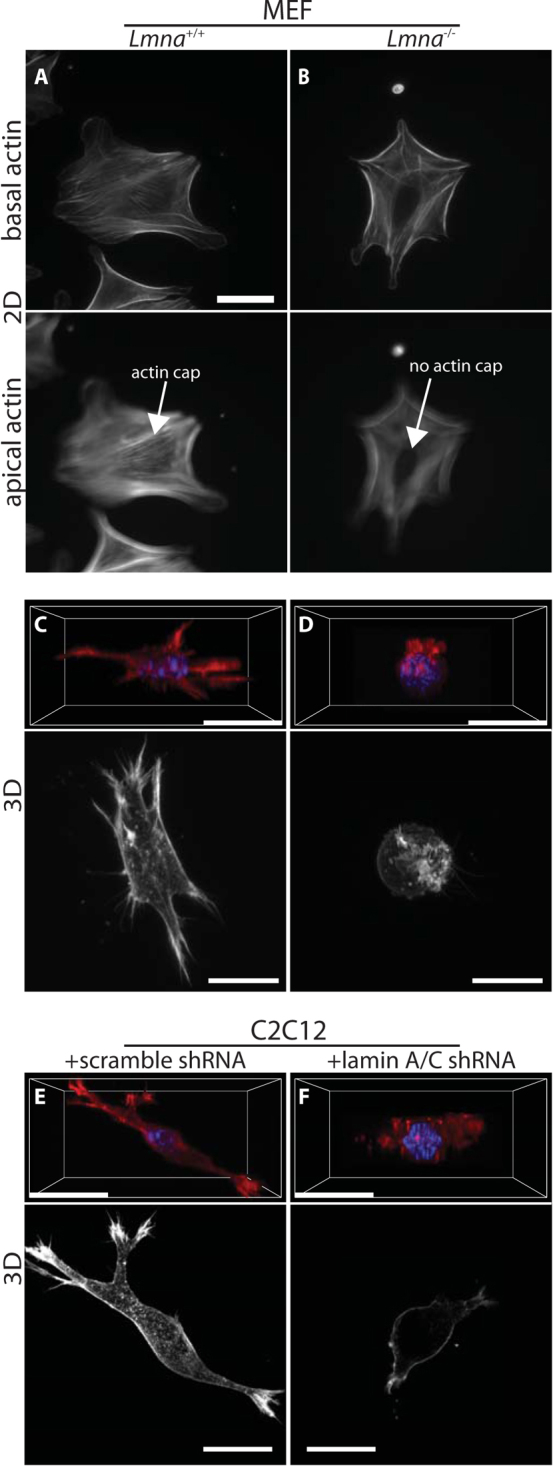
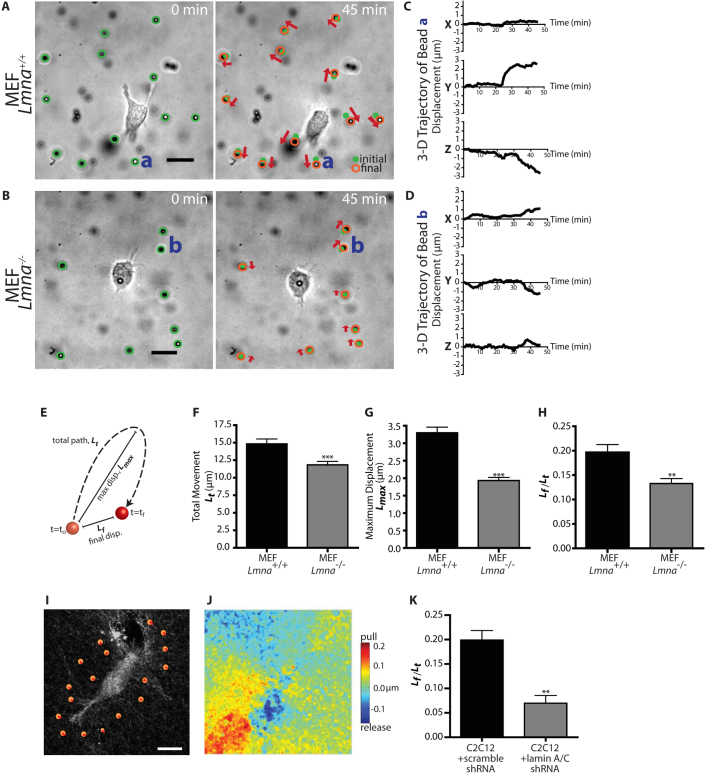
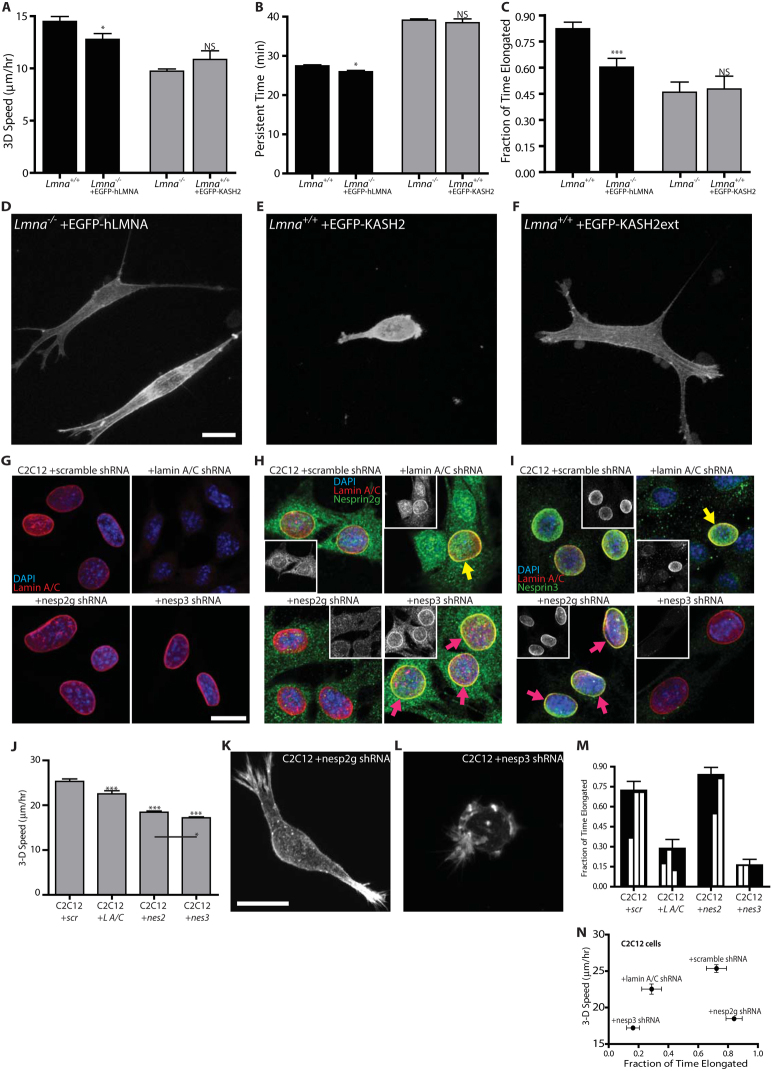
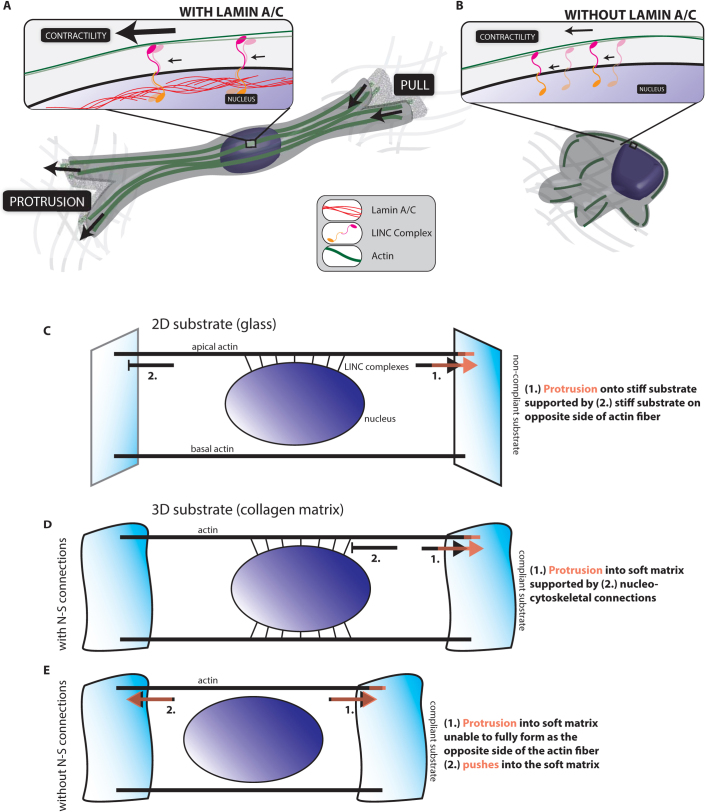
Cells often migrate in vivo in an extracellular matrix that is intrinsically three-dimensional (3D) and the role of actin filament architecture in 3D cell migration is less well understood. Here we show that, while recently identified linkers of nucleoskeleton to cytoskeleton (LINC) complexes play a minimal role in conventional 2D migration, they play a critical role in regulating the organization of a subset of actin filament bundles - the perinuclear actin cap - connected to the nucleus through Nesprin2giant and Nesprin3 in cells in 3D collagen I matrix. Actin cap fibers prolong the nucleus and mediate the formation of pseudopodial protrusions, which drive matrix traction and 3D cell migration. Disruption of LINC complexes disorganizes the actin cap, which impairs 3D cell migration. A simple mechanical model explains why LINC complexes and the perinuclear actin cap are essential in 3D migration by providing mechanical support to the formation of pseudopodial protrusions.


Figures

Figure 1
Figure 1. Lamin deficiency modulates cell motility and morphology when cells are embedded in a 3D matrix, not on planar substrates.
(A) and (B). Averaged speed (A) and persistence time of migration (B) of individual Mouse Embryonic Fibroblast (MEF) Lmna+/+ and Lmna−/− cells placed on collagen I-coated 2D substrates. Persistence time is the averaged time it takes for the direction of cell motility to become de-correlated. (C) and (D). Averaged speed (C) and persistence time of migration (D) of individual MEF Lmna+/+ and Lmna−/− cells inside a 3D collagen I matrix. (E) and (F). Averaged speed (E) and persistence time of migration (F) of individual mouse myoblasts (C2C12) transfected with scrambled shRNA or shRNA-depleted of lamin A/C inside a 3D collagen matrix. (G) and (H). Typical time-dependent overall morphology of Lmna+/+ (G) and Lmna−/− (H) MEFs embedded inside a collagen matrix. While arrows point to elongated morphology, black arrows point to rounded morphology. Scale bar, 20 μm. (I). Averaged number of actively growing membrane protrusions per cell per 90 min measured under high-magnification phase-contrast microscopy. Protrusions are deemed active when they are associated with significant traction of the matrix in their vicinity. Protrusion remnants at the rear end of motile cells are not counted. (J) and (K). Fraction of the time when cellular morphology of MEFs (A) or C2C12s (B) with or without lamin A/C is elongated as opposed to rounded up or collapsed. N = 10 cells per type of cell in triplicate for a total of 30 cells for each condition. Measurements in panels A–D, I and J are mean ± SEM. (***): P<0.001 (student t-test; N = 33 cells in triplicate for a total of 99 cells for each condition). Measurements in panels E, F, and K are mean ± SEM. (***): P<0.001 (one way ANOVA test; N = 33 cells in triplicate for a total of 99 cells).
Figure 2
Figure 2. Lamin deficiency severely affects 3D actin filament architecture of cells in 3D matrix.
(A–B). Actin filament organization of Lmna+/+ (A) and Lmna−/− MEFs (B) on 2D collagen-coated substrates. Wild-type cells show an organized perinuclear actin cap that wraps around the interphase nucleus, while knockout cells lack an actin cap(bottom panels); however, basal actin organization is mostly unchanged (top panels). (C–D). 3D perspective (top) and maximum-intensity projections in XY-plane (bottom) of actin filament organization in Lmna+/+ (A) and Lmna−/− MEFs (B) in a 3D collagen matrix. (C–D). 3D perspective (top) and maximum-intensity projections in XY-plane (bottom) of actin filament organization in control scrambled (A) and lamin A/C-depleted (B) C2C12 cells inside a 3D collagen matrix. Scale bar, 20 μm.
Figure 3
Figure 3. Lamin deficiency reduces the extent and modifies the rheological character of matrix remodeling during 3D migration.
(A) and (B). Typical deformation maps of the collagen matrix induced by an Lmna+/+ MEF (A) and an Lmna−/− MEF (B). These maps were obtained by simultaneously tracking the three-dimensional displacements of multiple 3.6 μm-diameter fiduciary carboxylated beads embedded in the collagen I matrix under phase contrast light microscopy. The lengths of the arrows represent three times the actual local magnitude of matrix deformation. The movie was recorded for 90 min. (C) and (D). Typical time-dependent three-dimensional x, y, and z coordinates of single fiduciary beads in the matrix denoted a and b in panels A and B, respectively, near a Lmna+/+ cell (C) and near a Lmna−/− cell (D). (E). Graphical definition of values used to assess matrix remodeling. (F) and (G). Total (Lt) and maximum movements (Lmax) of beads embedded in the matrix and surrounding Lmna+/+ and Lmna−/− cells. Beads were tracked for 90 min. (H). Percentage of permanent matrix deformation mediated by Lmna+/+ and Lmna−/− cells. Permanent deformation is measured by the ratio of the distance between first and final bead positions (Lf) divided by the total displacement (Lt). This number is 1 when cell-mediated deformation of the matrix is irreversible or permanent and 0 when the deformation is perfectly reversible or elastic. (I). Reflection confocal micrograph showing collagen fiber organization and “virtual beads” defined to help assess the magnitude of matrix remodeling induced by cell-induced traction and release of collagen fibers. (J). “Heat” map of matrix remodeling. Red regions denote areas of maximum displacement of the collagen matrix towards the cell body, while blue show regions of maximum release away from the cell body. Measurements in panels F–H, and K represent mean ± SEM. (***): P<0.001 (student t-test). Scale Bar: 20 μm.
Figure 4
Figure 4. Disruption of LINC complexes recapitulates the migratory phenotype caused by lamin deficiency.
(A–C). Cell speed (A), persistence time of migration (B), and fraction of time when the cellular morphology is elongated (C) for Lmna+/+ MEFs (first column), Lmna−/− MEFs transfected with EGFP-lamin A (second column), Lmna−/− MEFs (third column), and Lmna+/+ MEFs transfected with EGFP-KASH2, which displaces the LINC complexes from the nuclear envelope Measurements in panels A–C represent mean ± SEM. N = 13 cells per type of cell in triplicate for a total of 39 cells. *: P< 0.05 comparing with Lmna+/+ cells; ns: non-significant comparing with Lmna−/− MEFs. (D–F). Actin filament organization in Lmna−/− cells transfected with EGFP-lamin A (D), Lmna+/+ cells transfected with EGFP-KASH2 (E), and Lmna+/+ cells transfected with the control construct EGFP-KASHext (F) (G–I). Immuno-localization of lamin A/C (G), Nesprin 2 giant (H), and Nesprin 3 (I) in control C2C12 cells transfected with scrambled shRNA (top left), lamin A/C-depleted C2C12 cells (top right), Nesprin 2 giant-depleted C2C12 cells (bottom left), and Nesprin 3-depleted C2C12 cells (bottom right). Lamin A/C immunostaining is unaffected by shRNA-depletion of either Nesprin 2 giant or Nesprin 3. Both Nesprins, however, appear slightly mislocalized following Lamin A/C depletion (compare to cells still expressing lamin A/C; yellow arrows). Interestingly, each Nesprin appears more dense at the nuclear envelope when the other is knocked down (purple arrows). Insets in panels (H) and (I) show Nesprin 2 giant and Nesprin 3 fluorescence immunostaining, respectively. (J) Speed of matrix-embedded control scrambled, Nesprin 2 giant-depleted, and Nesprin 3-depleted C2C12s. (K–L). Actin filament organization in matrix-embedded Nesprin 2 giant-depleted C2C12s (K), and Nesprin 3-depleted C2C12s (L) embedded. (M). Fraction of time when cellular morphology of matrix-embedded control shRNA scramble cells, shRNA lamin A/C-depleted cells, shRNA Nesprin 2 giant-depleted cells, and shRNA Nesprin 3-depleted cells is elongated as opposed to rounded up or collapsed. Inset, relative distributions (quarter-binned) of time spent in the collapsed (0) and elongated (1) (N). 3D cell speed vs. fraction of time elongated for C2C12 cells embedded in a collagen matrix highlighting the anomalous behavior of Nesprin 2-depleted cells. Scale Bar: 20 μm.
Figure 5
Figure 5. Nucleus-cytoskeleton connections are essential to 3D migration.
(A) and (B). Cartoons of 3D embedded cells (A) with and (B) without Lamin A/C. Cells expressing lamin A/C are able to able to support actin-based protrusions and pulling because of intact nucleo-cytoskeletal connections. In cells devoid of lamin A/C, actin filaments are no longer held in place at the nuclear envelope by LINC complexes, removing nuclear support of actin-based movement. (C). Modeling the actin fibers in a cell on a 2D substrate. Lamellipodial protrusions are supported by connections to the stiff collagen-coated glass substrate. (D). Modeling the actin fibers in a cell embedded in a soft 3D matrix. Protrusions are supported by nucleo-cytoskeletal (N–S) connections in cells with intact LINC complexes. (E). For cells embedded in a 3D matrix without intact LINC complexes, the cell is unable to sustain protrusions as actin fibers are pushing through a soft matrix.

Similar articles

Cited by

References

    1. Pollard T. D. & Borisy G. G. Cellular motility driven by assembly and disassembly of actin filaments. Cell 112, 453–465 (2003). - PubMed
    1. Ridley A. J. et al. Cell migration: integrating signals from front to back. Science 302, 1704–1709 (2003). - PubMed
    1. Sahai E. & Marshall C. J. Differing modes of tumour cell invasion have distinct requirements for Rho/ROCK signalling and extracellular proteolysis. Nat Cell Biol 5, 711–719 (2003). - PubMed
    1. Symons M. & Segall J. E. Rac and Rho driving tumor invasion: who's at the wheel? Genome Biol 10, 213 (2009). - PMC - PubMed
    1. Kedrin D., van Rheenen J., Hernandez L., Condeelis J. & Segall J. E. Cell motility and cytoskeletal regulation in invasion and metastasis. J Mammary Gland Biol Neoplasia 12, 143–152 (2007). - PubMed

Publication types